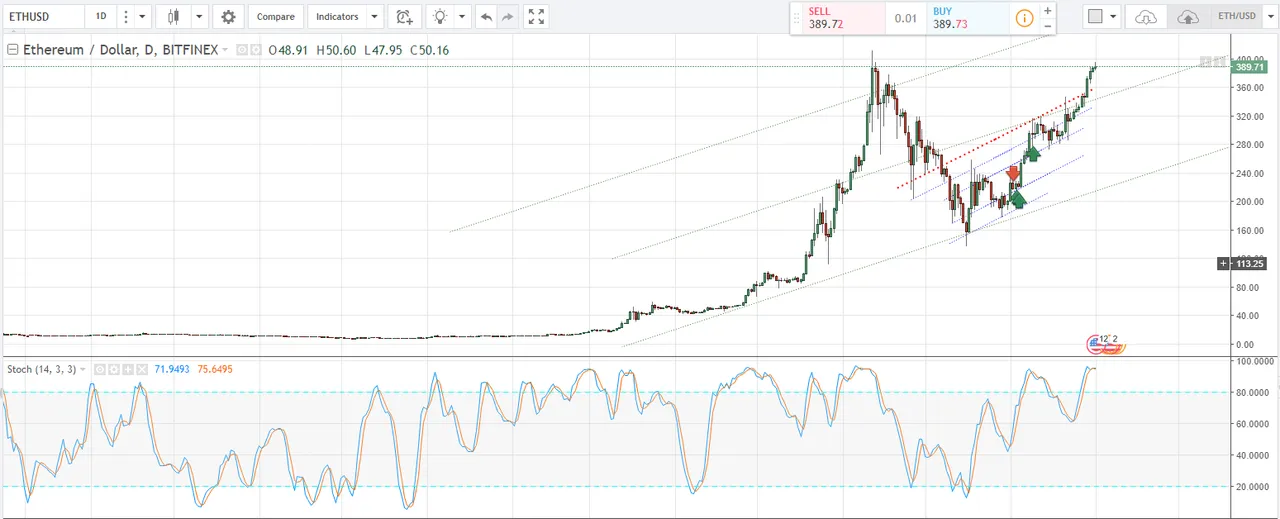
Analysis:
Although ETH prices have hit a high of $420, the actual closing high is around the current high now that ETH is trying to break above. While ETC has seen a 30% increase in recent day.. The only thing holding back ETH is this closing resistance level of $390. If ETH cannot break above this level for a sustainable duration of time, I think ETH will be in for a lot of hurt and might even see back to $240 - $280. As it stands we are bullish in sentiment so as far as doom and gloom is concerned we are safe. But we always have to keep in mind the other possibilities of course. Once the highs are broken and support established, a good chance for ETH to reach $430 - $500 in the near term.
Foot Note:
When analyzing this chart, you will notice the Slow Stochastics indicator. I find this indicator to be the complete indicator compared to the vast majority out there. Lets explore the terms I will be using. Also use the indicator based on its respective time-frame:
Time-Frame:
1 hour - Lasts 1 hour - Few days
Daily - Last Days - Week(s)
Weekly - Last Week(s) to Month(s)
Term used:
OB - OverBought (above 80)
OS - OverSold (Below 20)
Bullish - Above 50
Bearish - Below 50
Trend - Cross up in both channel line or Cross down in both channel line.
Follow me if this has been helpful, and don't forget to give me an upvote if you feel that this article has helped in some way.