Analysis:
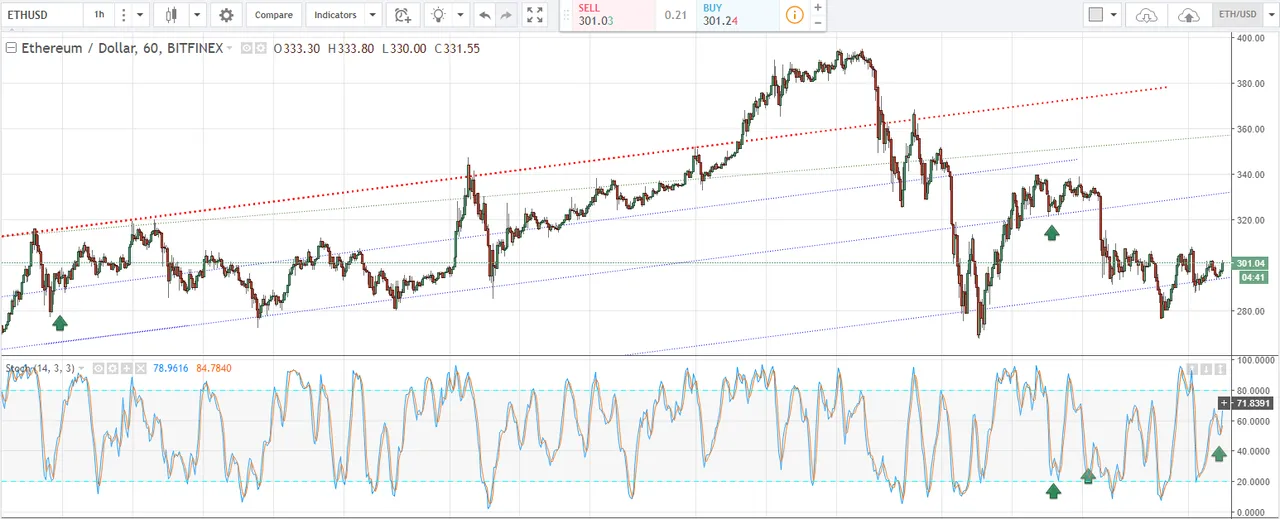
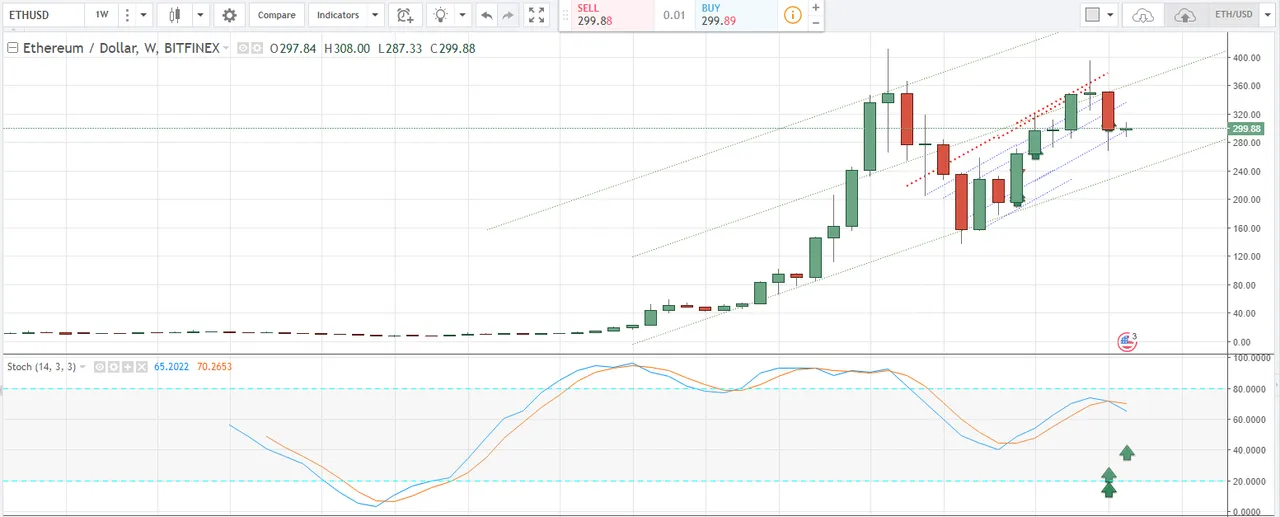
The current resistance of $300 has always been a key resistance and will be a key support in the future. There is a rule that states that a breakout above a resistance must hold for at least 3 days. When applying our long-term and short-term signals and sentiment, we should also take these into account. Therefore price testing the $300 level needs to hold also for 3 weeks and 3 months to find solid footing. If you look at the weekly chart you will see that we are now on the 4th and decisive week following a 3rd week that rested on the $300 level.
If we break below then you can see why I had the $240 level in mind as well.
Foot Note:
When analyzing this chart, you will notice the Slow Stochastics indicator. I find this indicator to be the complete indicator compared to the vast majority out there. Lets explore the terms I will be using. Also use the indicator based on its respective time-frame:
Time-Frame:
1 hour - Lasts 1 hour - Few days
Daily - Last Days - Week(s)
Weekly - Last Week(s) to Month(s)
Term used:
OB - OverBought (above 80)
OS - OverSold (Below 20)
Bullish - Above 50
Bearish - Below 50
Trend - Cross up in both channel line or Cross down in both channel line.
Follow me if this has been helpful, and don't forget to give me an upvote if you feel that this article has helped in some way.