
SUMMARY
Note: For anyone who missed the BitcoinLive Information Webinar, here is the replay link: 
Note: Founder Membership Subscription Emails are being sent to the those who registered for the short list today and tomorrow!!
As of June 4, ALL Crypto Analysis will be posted on the BitcoinLive channel and Steemit will be dedicated for Equity, Commodity and Options Analysis. To Signup for the BitcoinLive limited Founding Membership slots, use this link: https://get.bitcoin.live/haejin/
__
Ethereum (ETH) is displaying a high similarity index to Bitcoin (BTC). This is often called the "All the Same Market Phenomena". In other words, many holders of ETH are also holders of BTC. The combined social mood therefores is reflected in the price of BTC and ETH generating a high similarity index.
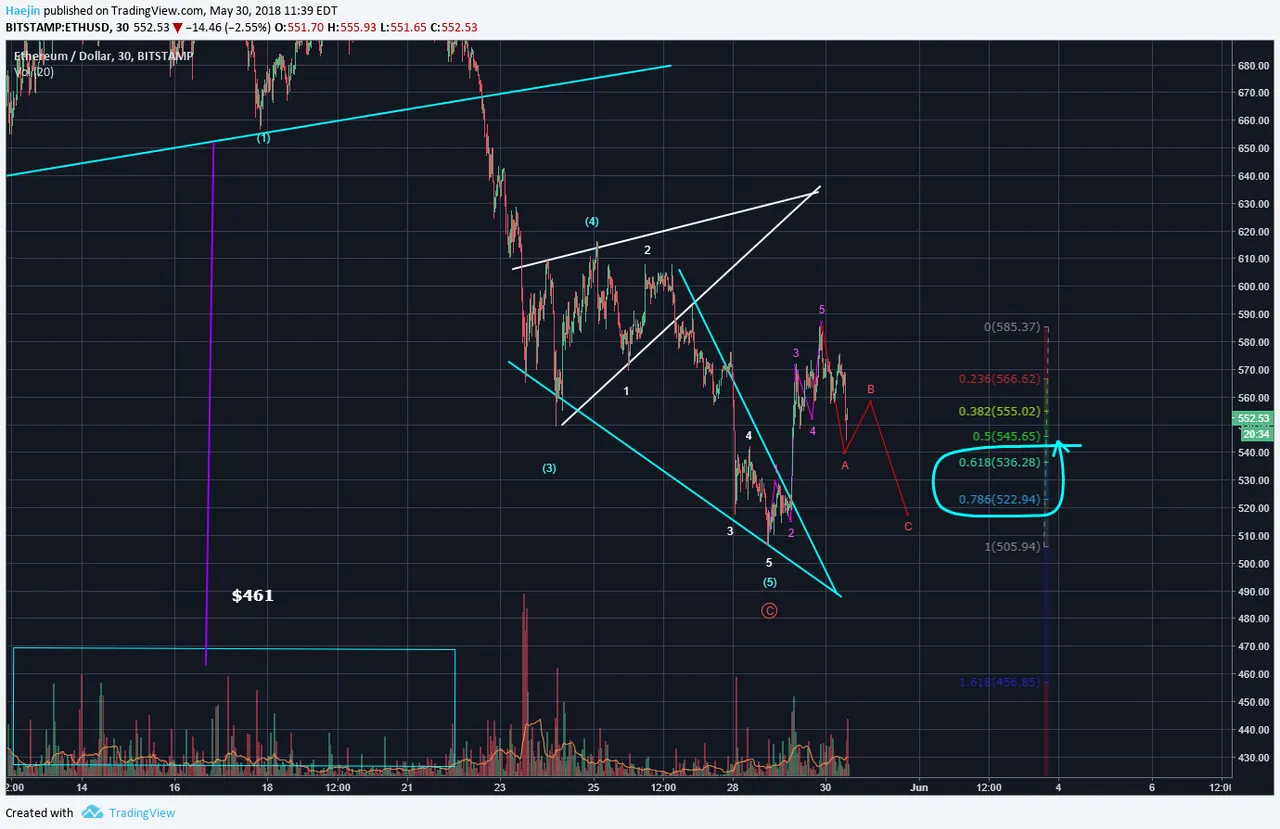
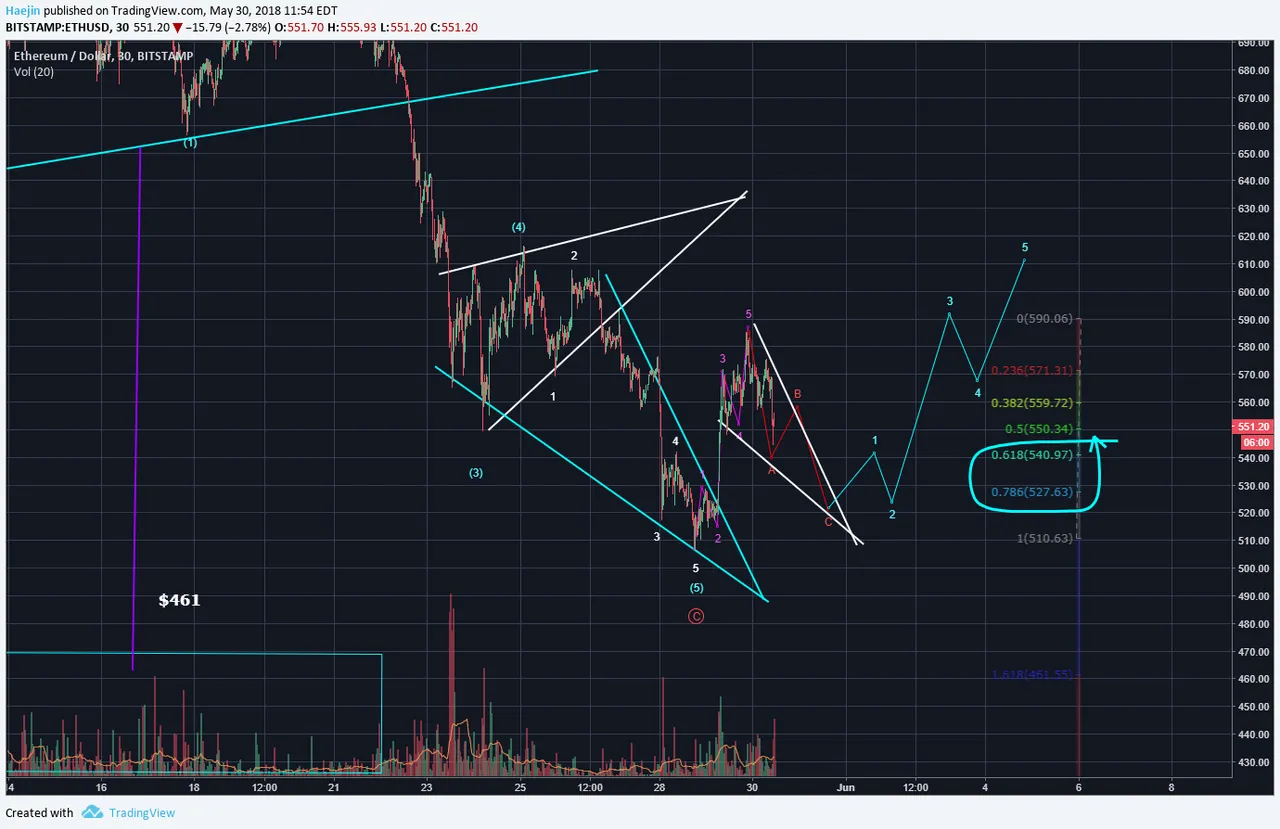
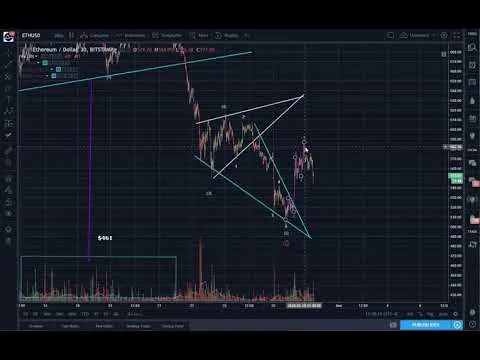
The below short term chart is also showing the blue downward wedge but it is not an ending diagonal sequence. Price broke out and impulsed up five waves and obviously correcting today. I've placed the red C wave towards the 0.78 Fib level. It's not a required level of retrace but expected.
If a second impulse motive can deliver $610 or higher levels; it would be a significant milestone. The second impulse would provide a greater confidence to the trend reversal.
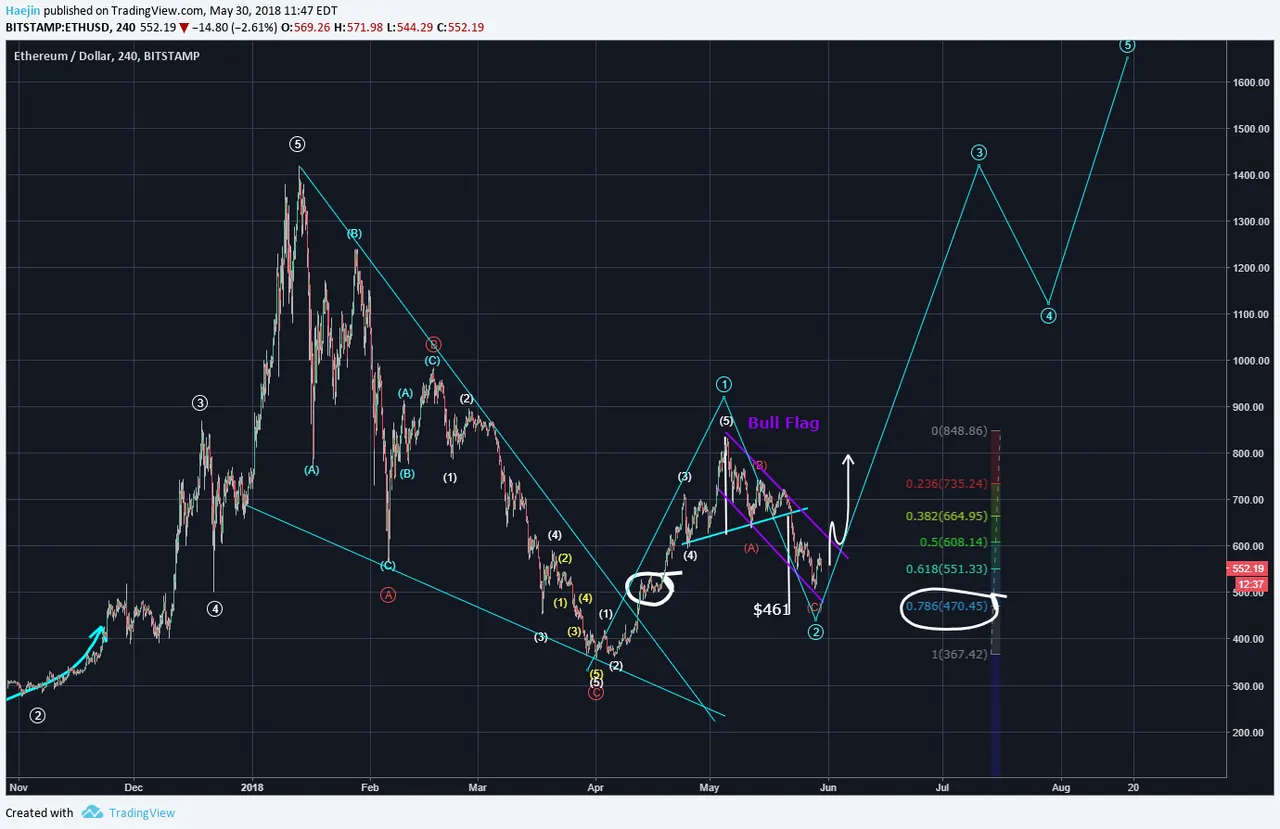
The longer term also shows a bull flag (purple). The white arrow shows the the upper purple trendline needs to be breached and the $610 or higher from the second impulse motive would allow that.
Legal Disclaimer: I am not a financial advisor nor is any content in this article presented as financial advice. The information provided in this blog post and any other posts that I make and any accompanying material is for informational purposes only. It should not be considered financial or investment advice of any kind. One should consult with a financial or investment professional to determine what may be best for your individual needs. Plain English: This is only my opinion, make of it what you wish. What does this mean? It means it's not advice nor recommendation to either buy or sell anything! It's only meant for use as informative or entertainment purposes.
Please consider reviewing these Tutorials on:
Elliott Wave Counting Tutorial #1
Elliott Wave Counting Tutorial #2
Elliott Wave Counting Tutorial #3
Laddering and Buy/Sell Setups.
Laddering Example with EOS
Tutorial on the use of Fibonacci & Elliott Waves
@haejin's Trading Nuggets
Essay: Is Technical Analysis a Quantum Event?
Follow me on Twitter for Real Time Alerts!!
Follow me on StockTwits for UpDates!!
--
--

