
SUMMARY
Note: For anyone who missed the BitcoinLive Information Webinar, here is the replay link: 
As of June 4th, ALL Crypto Analysis will be posted on the BitcoinLive channel and Steemit will be dedicated for Equity, Commodity and Option Analysis. To Signup for the BitcoinLive limited Founding Membership slots, use this link: https://get.bitcoin.live/haejin/
__
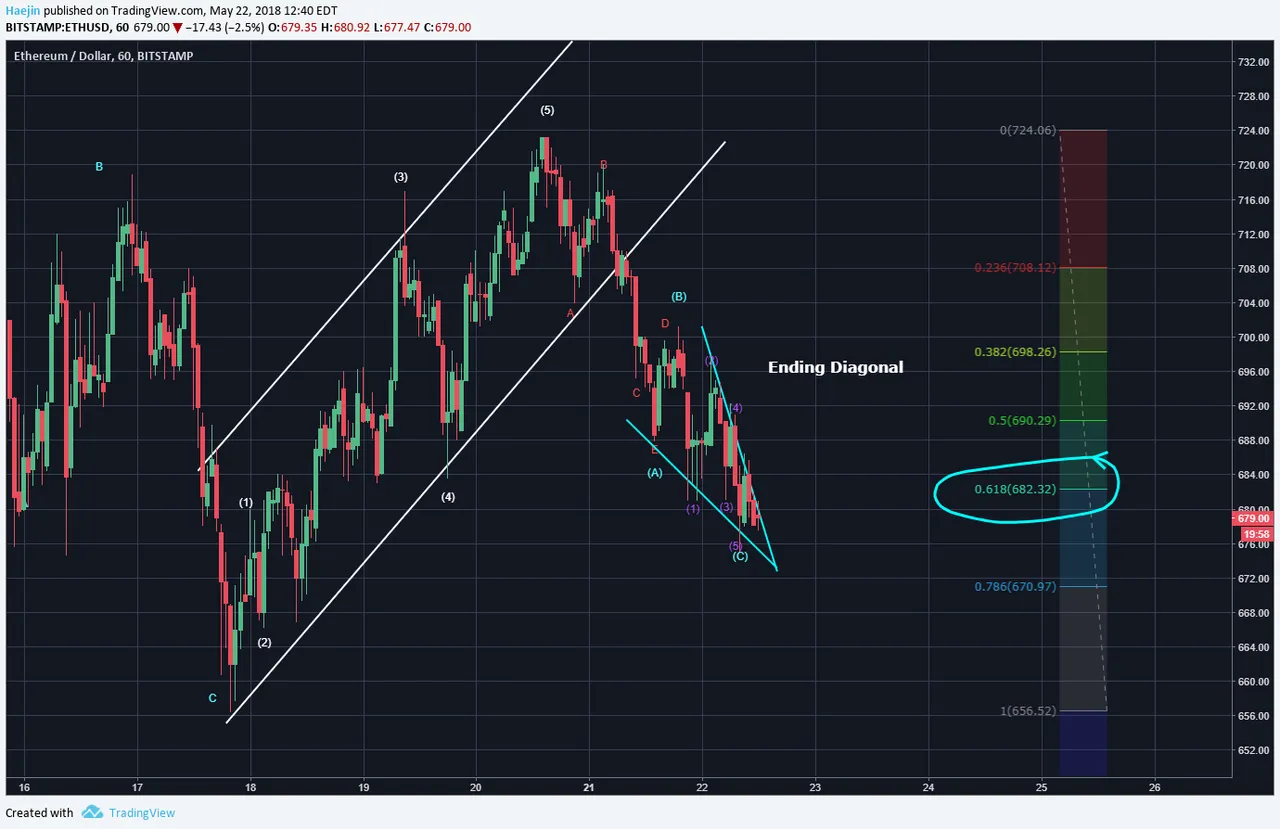
Here is the chart for Ethereum (ETH) and as shown, there is good probability that the minor correction has completed, if not, shortly. The five wave impulse (white) is being corrected and the blue ABC waves have exceeded the 0.618 Fib zone. This thus makes the correction quite mature and at terminal end of its life cycle. I've labeled the Ending Diagonal for the blue C wave. While ED usually occurs at the terminal end of wave 5s; they are seen on wave Cs of an ABC correction. This is the only time when an impulse label can be overlapped.
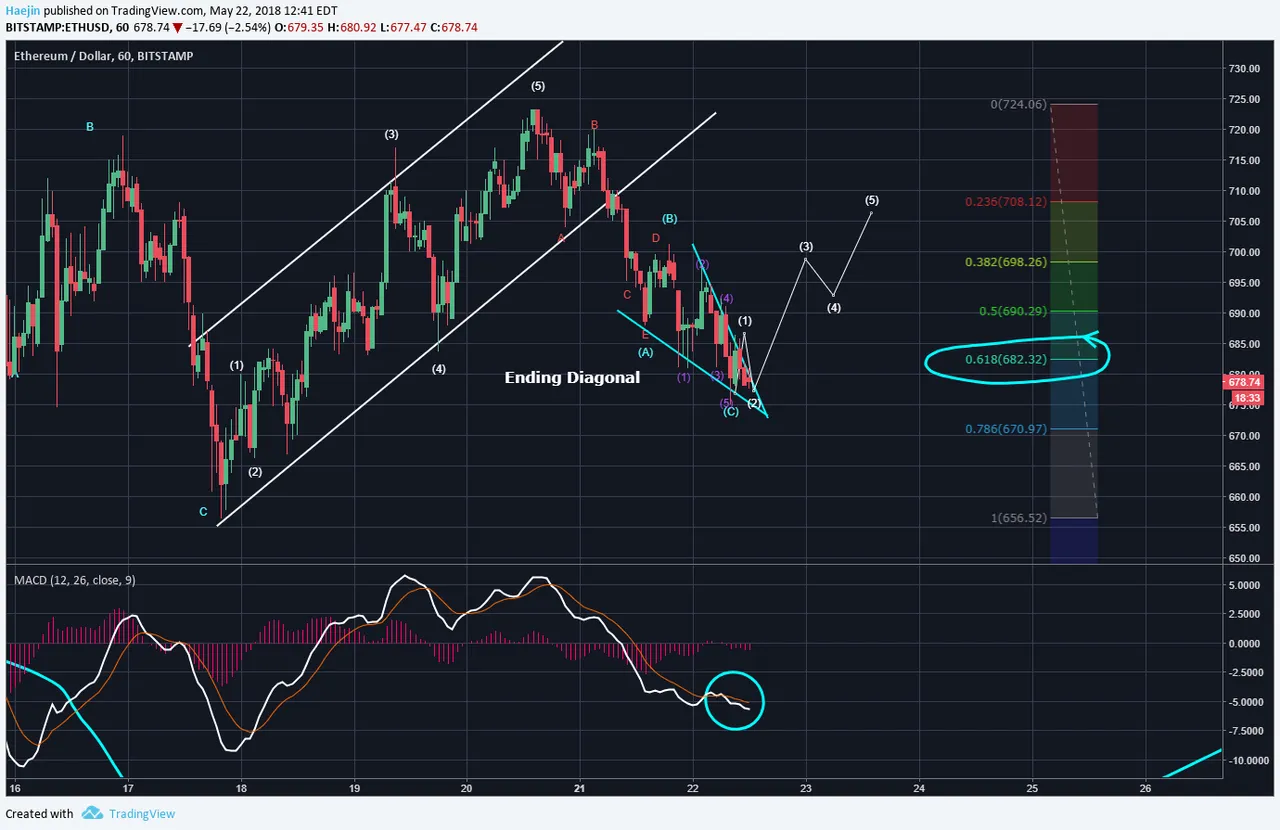
So, what's next? Well, take a look at the MACD. It looks to be on the oversold side (blue circle). Price needs to confirm the correction bottom by impulsing upwards (white). So, we need to start seeing higher highs. ETH is currently following Bitcoin and no longer leading as it had briefly the other week.
Legal Disclaimer: I am not a financial advisor nor is any content in this article presented as financial advice. The information provided in this blog post and any other posts that I make and any accompanying material is for informational purposes only. It should not be considered financial or investment advice of any kind. One should consult with a financial or investment professional to determine what may be best for your individual needs. Plain English: This is only my opinion, make of it what you wish. What does this mean? It means it's not advice nor recommendation to either buy or sell anything! It's only meant for use as informative or entertainment purposes.
Please consider reviewing these Tutorials on:
Elliott Wave Counting Tutorial #1
Elliott Wave Counting Tutorial #2
Elliott Wave Counting Tutorial #3
Laddering and Buy/Sell Setups.
Laddering Example with EOS
Tutorial on the use of Fibonacci & Elliott Waves
@haejin's Trading Nuggets
Essay: Is Technical Analysis a Quantum Event?
Follow me on Twitter for Real Time Alerts!!
Follow me on StockTwits for UpDates!!
--
--

