Solana has become the number one challenger for Ethereum. The chain has gone through a real roller coaster, a sharp collapse two years ago after the FTX saga, and a major recovery in 2024. Recently it has just surpassed BNB on the rankings. Ethereum on the other hand has gotten an ETF that was just approved and has a tone L2 chains on it.
How are the two major chains doing in the last period? Let’s take a look.
The two chains have a different approach. Ethereum has now clearly pivoted to L2 solutions for mass adoption. Solana on the other hand is going L1 first approach, trying to incorporate all the apps on layer one while keeping the fees low. This obviously comes at a cost as there is a need for a big and expensive infrastructure for this.
We will be looking at data for:
- Number of wallets
- Active wallets
- Number of daily transactions
- Fees
- TVL
- Market cap
The data is extracted from https://ethscan.com/, DefiLama, Dune Analytics, the Block etc.
Ethereum has been around since 2015, while Solana started operating in 2020. Because of this the period that we will be looking at is
Number of Wallets
First the number of wallets created. Here is the chart:
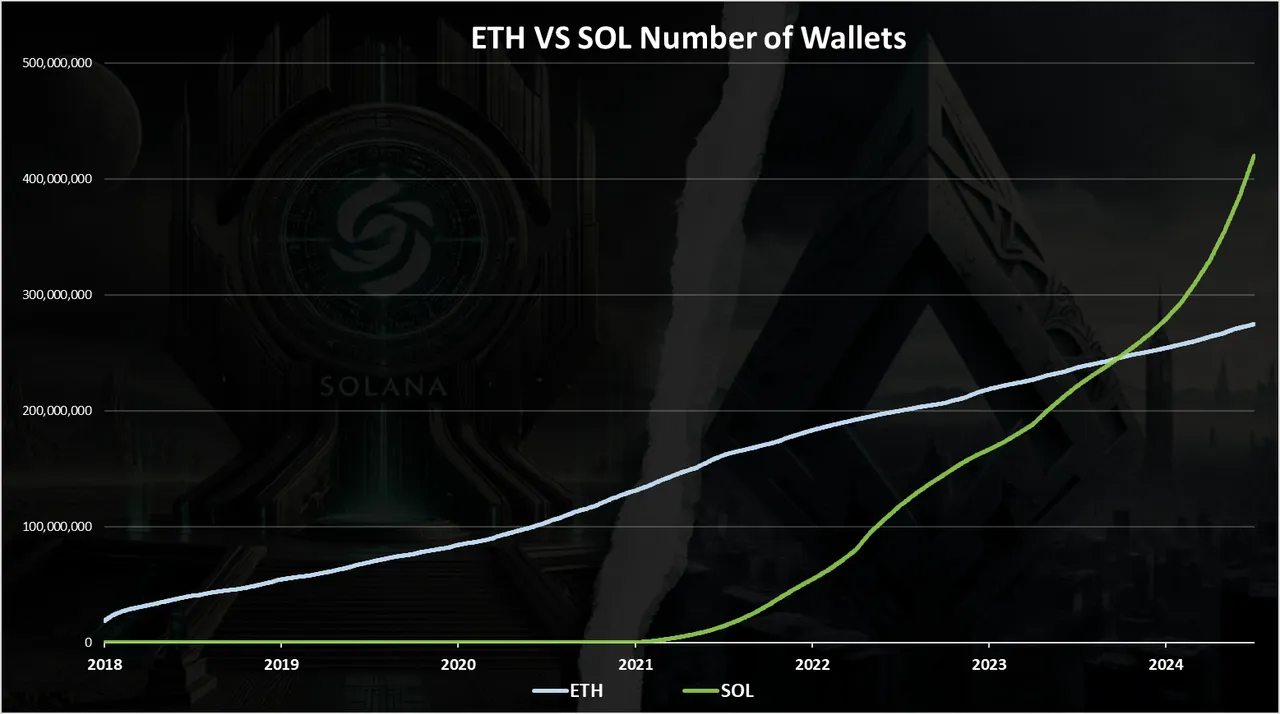
We can see that Solana has now surpassed Ethereum and has more wallets. Note that creating wallets on both Ethereum and Solana is free, so a lot of the time these actions can be seen as a spam. It doesn’t really mean that Ethereum has 300M users and Solana 400M.
What comes at cost are transactions. Let’s see how much of these wallets are actually active and making transactions.
Active Wallets
How many wallets are being used? Here is the chart.
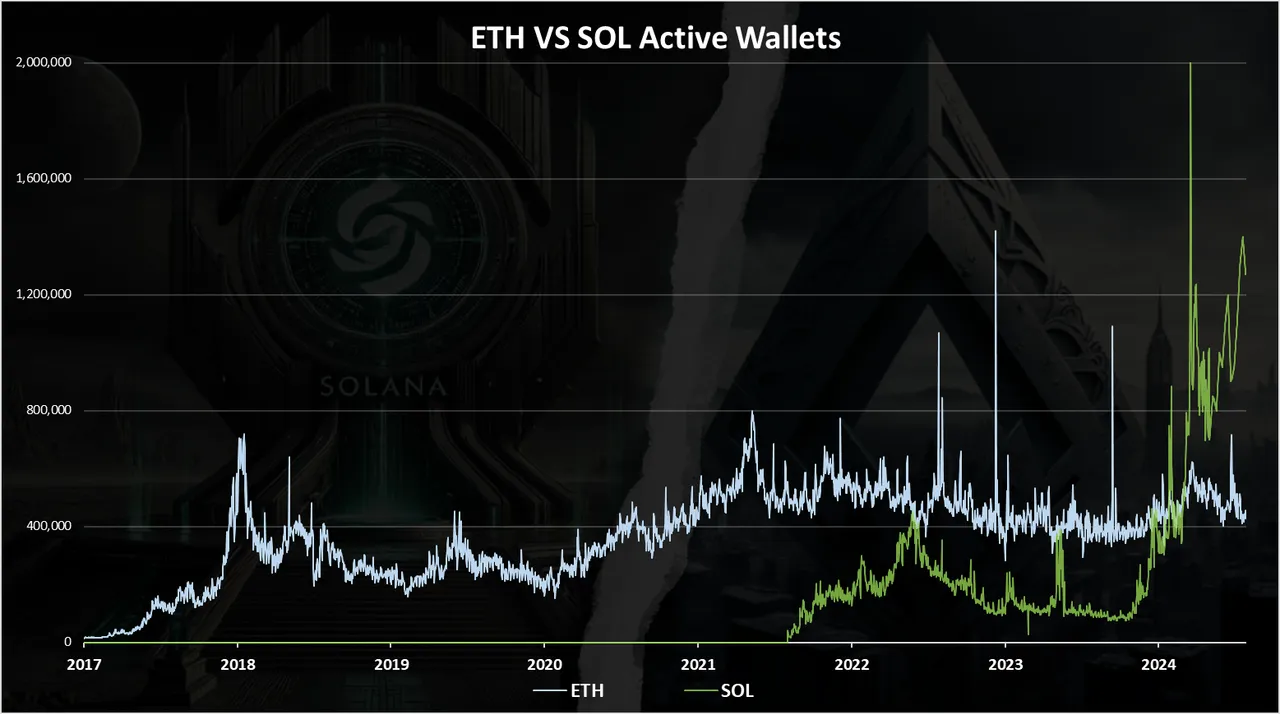
Here we can see that Solana has recently surpassed Ethereum in the number of active wallets as well. While Ethereum has been hovering around 500k DAUs, the number of daily active wallets on Solana has grown and surpassed 1M and even touching 2M per day on few occasions.
Number of Daily Transactions
Here is the chart for the number of daily transactions.
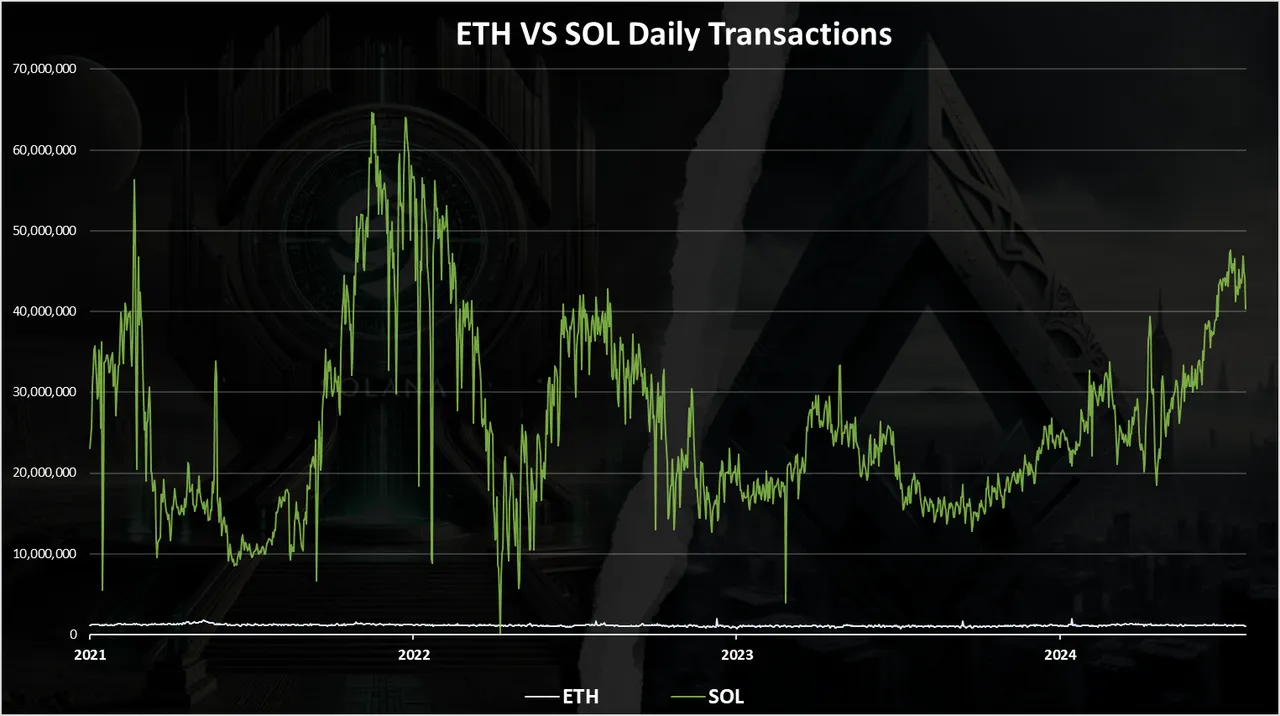
In terms of daily transactions Solana is absolutely dominant. Ethereum has around 1.2M transactions and the line for the number of transactions on ETH is down and almost flat on the chart.
Solana is know to be fast and cheap and the number of transactions has been hovering between 20M to 60M in a bull run. In the recent period the transactions has been growing again and have come close to 50M again.
When we zoom in 2024 we get this:
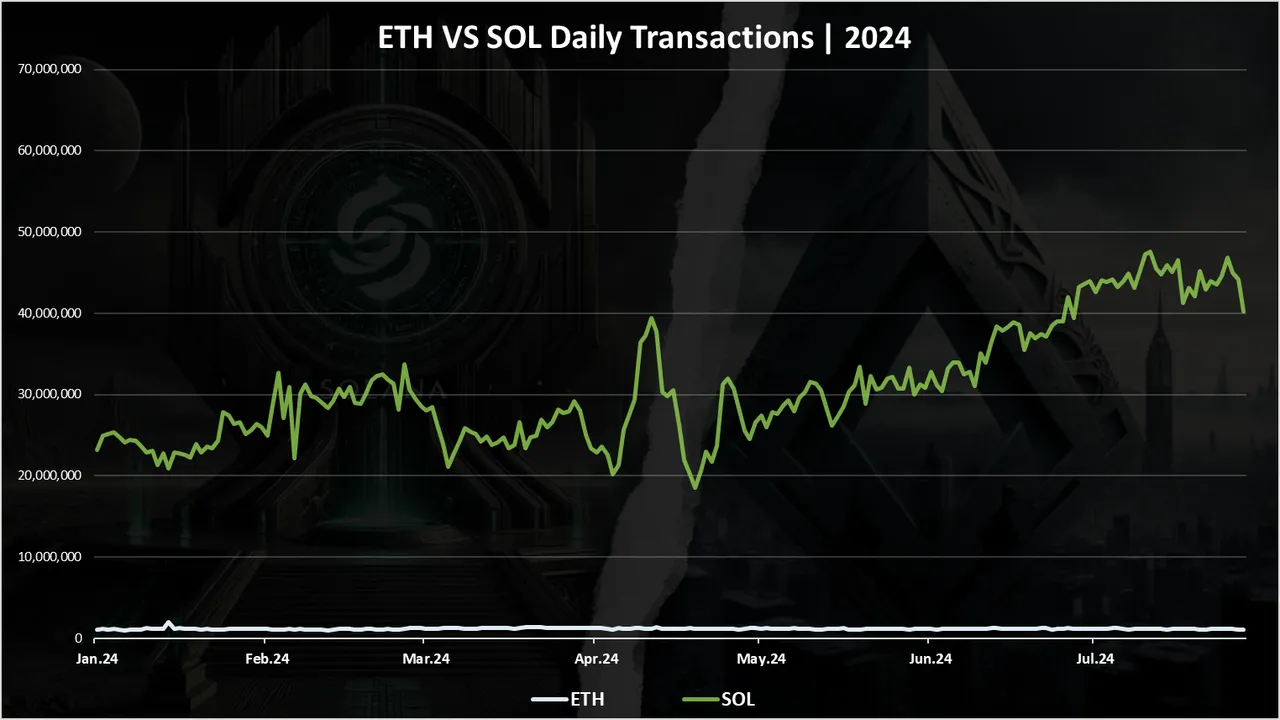
Here we can notice the steady growth in the number of transactions on Solana in 2024. Starting from around 25M and going up to 48M per day. Ethereum meanwhile has been steady around 1.2M.
Fees
The chart for the fees looks like this.
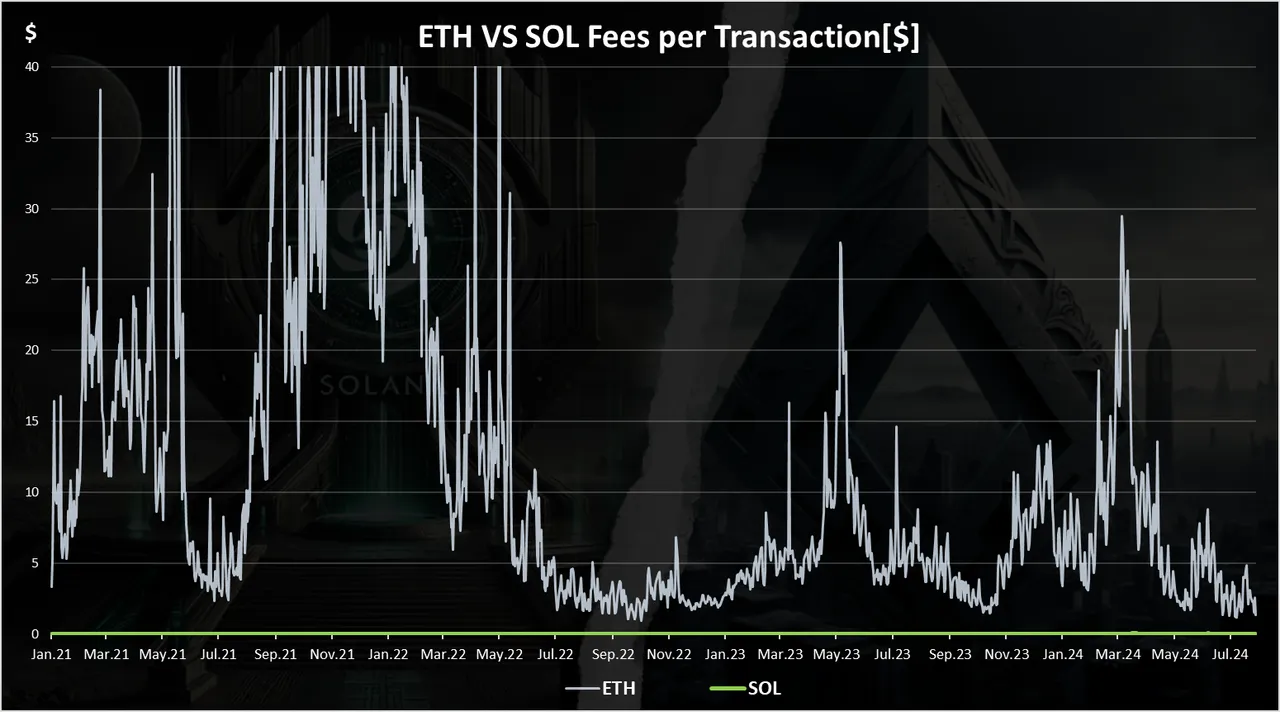
These are the average daily fees per transaction in $ value.
In terms of fees the line for Ethereum is clearly visible while the line for Solana is on the bottom of the chart. Fees on Ethereum have been volatile, going up to 50$ from a few dollars. In the recent period they have been low around 2$ to 3$ per transaction. But even this is high compared to fees on Solana where they have been less than a cent for most of the period. In 2024 though the fees on Solana have increased a bit and are now around one cent, 0.01$.
TVL
How about Total Value Locked? This is a metric that usually represents the amount of outside capital stored in DeFi protocols on chains. Here is the chart.
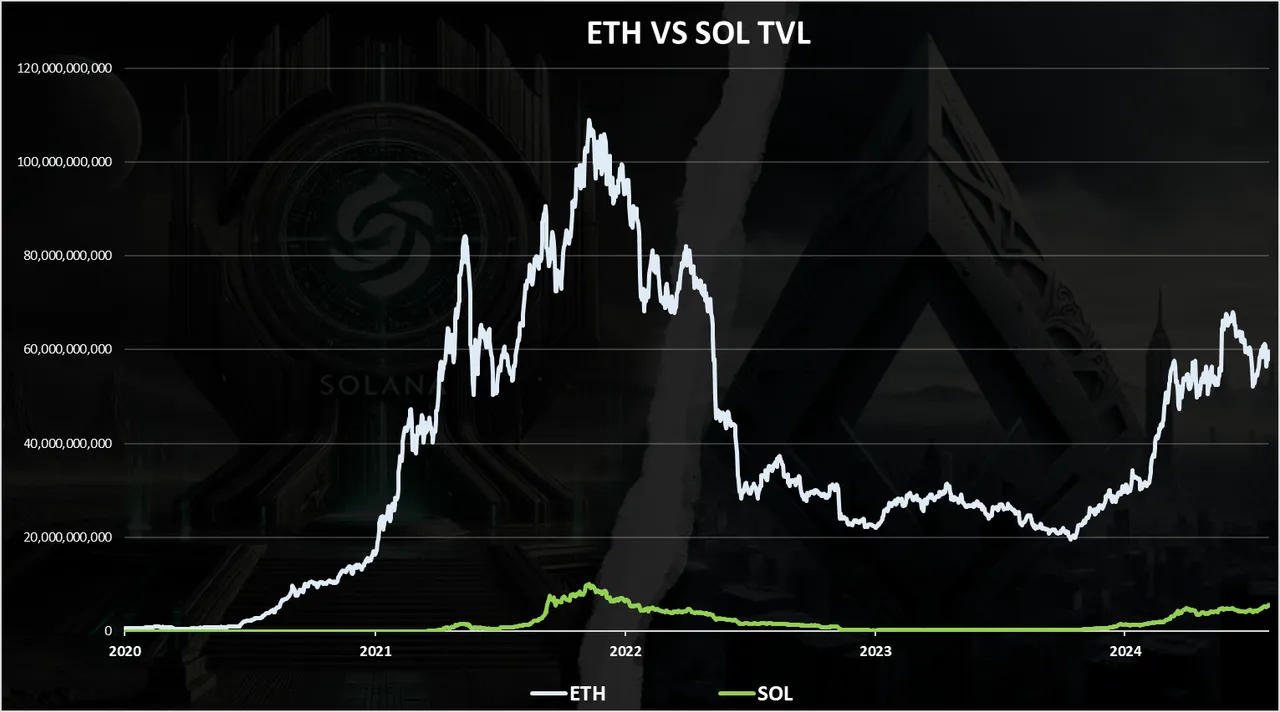
When it comes to TVL, Ethereum is leading by a lot. It now has around 60B in TVL stored in DeFi apps on Ethereum like staking, lending, DEXs etc. Solana is now close to 10B but still far from the ETH numbers. This tells the story that despite all the activity on Solana the capital is still in Ethereum for now.
Ethereum VS Solana Market Cap
The interesting topic for Ethereum VS Solana is will Solana overtake Ethereum at some point?
Here is the historical chart for the Ethereum VS Solana market cap.
Ethereum is obviously dominant when it comes to market cap. At the moment Solana is at all time high when compared to Ethereum but is still struggling to get 20% of the Ethereum market share. In most of its existence it has been less than 10%.
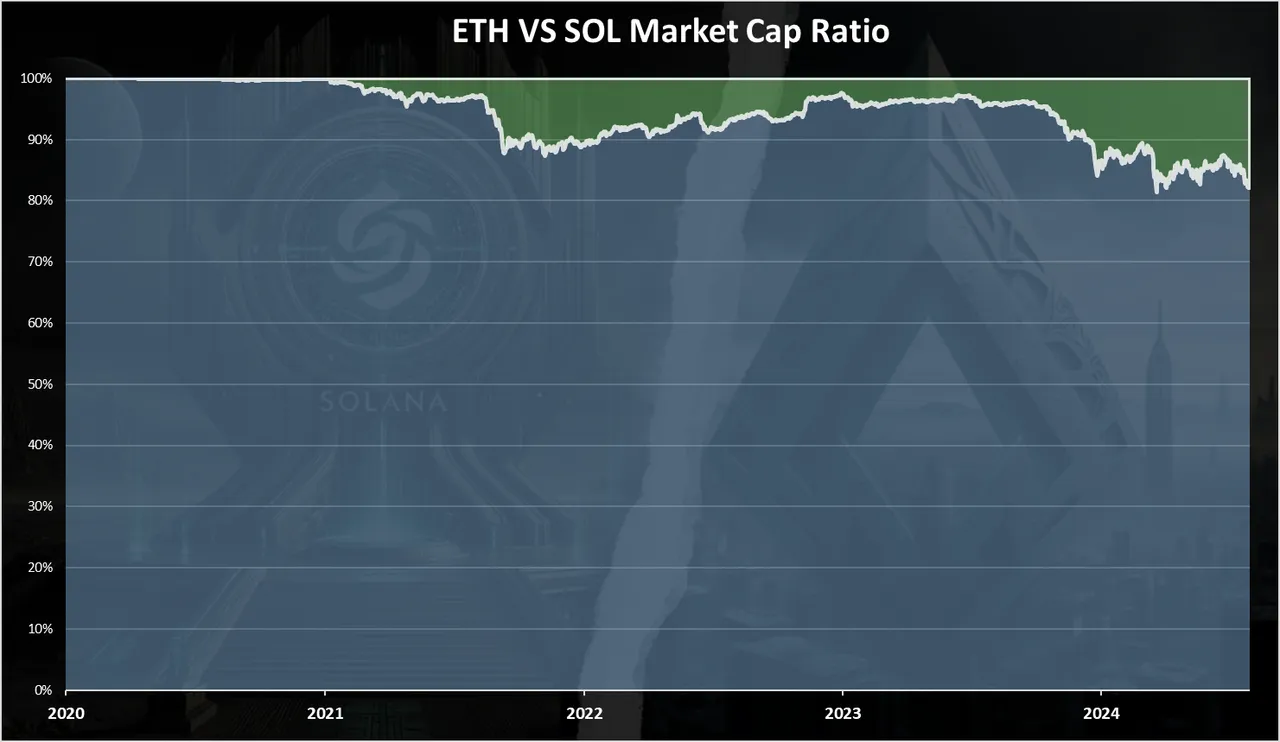
Here is the chart how the ratio of the market cap between the two looks at the moment:
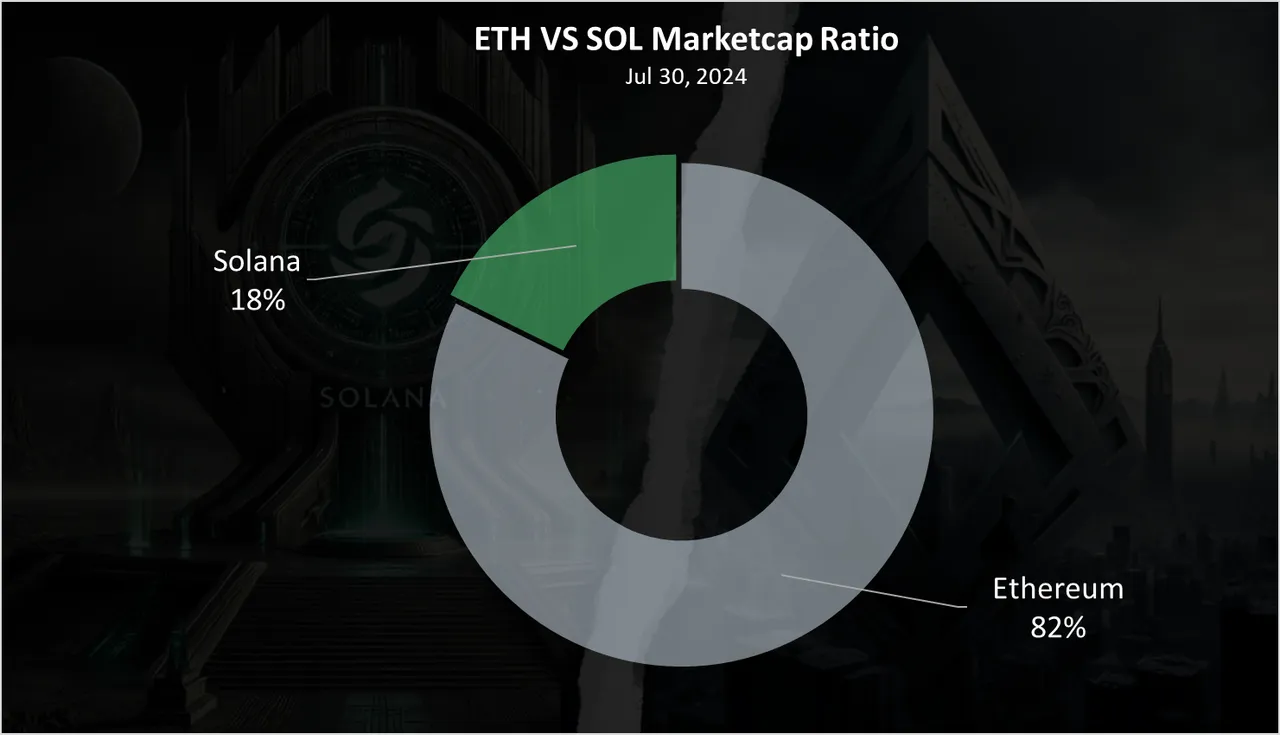
An 82% for ETH, and 18% for Solana. At the highest point for Solana.
From all the above it’s obvious that Solana has gain a massive traction in 2024 and overtook Ethereum in terms of active wallets, transactions etc. But in terms of capital Ethereum is still dominant by a lot.
All the best
@dalz