Hey folks,
Although MACD and RSI looks very Bullish, lot of resistances $225, $245 present on the upside move.
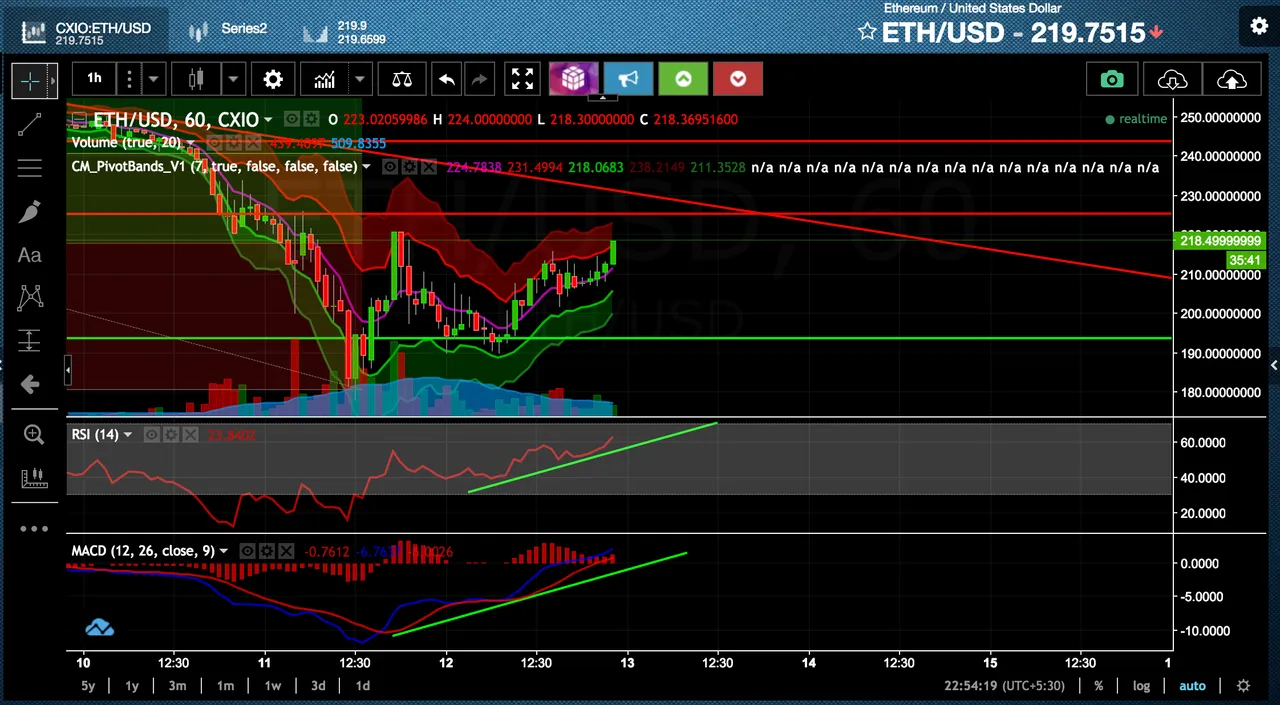
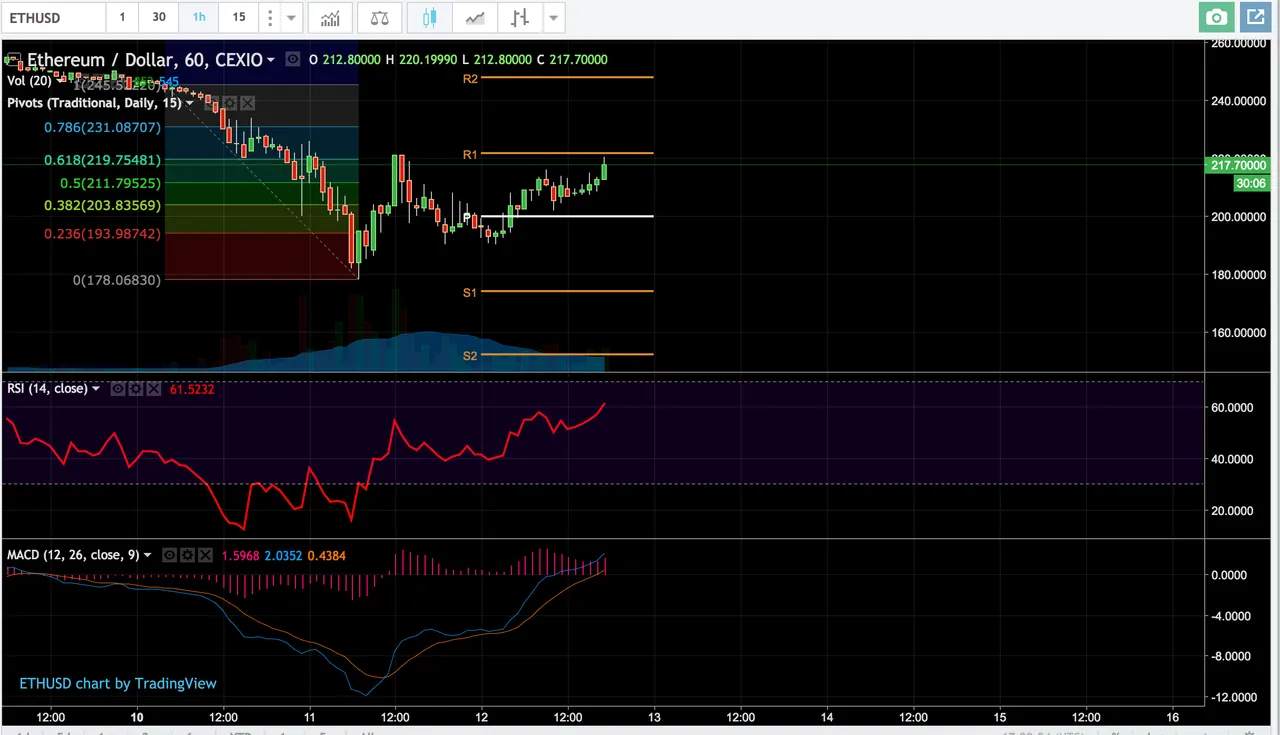
- Resistance of $220 according to daily pivot band
- Weekly Pivot band

Trendlines: Supports and Resistances

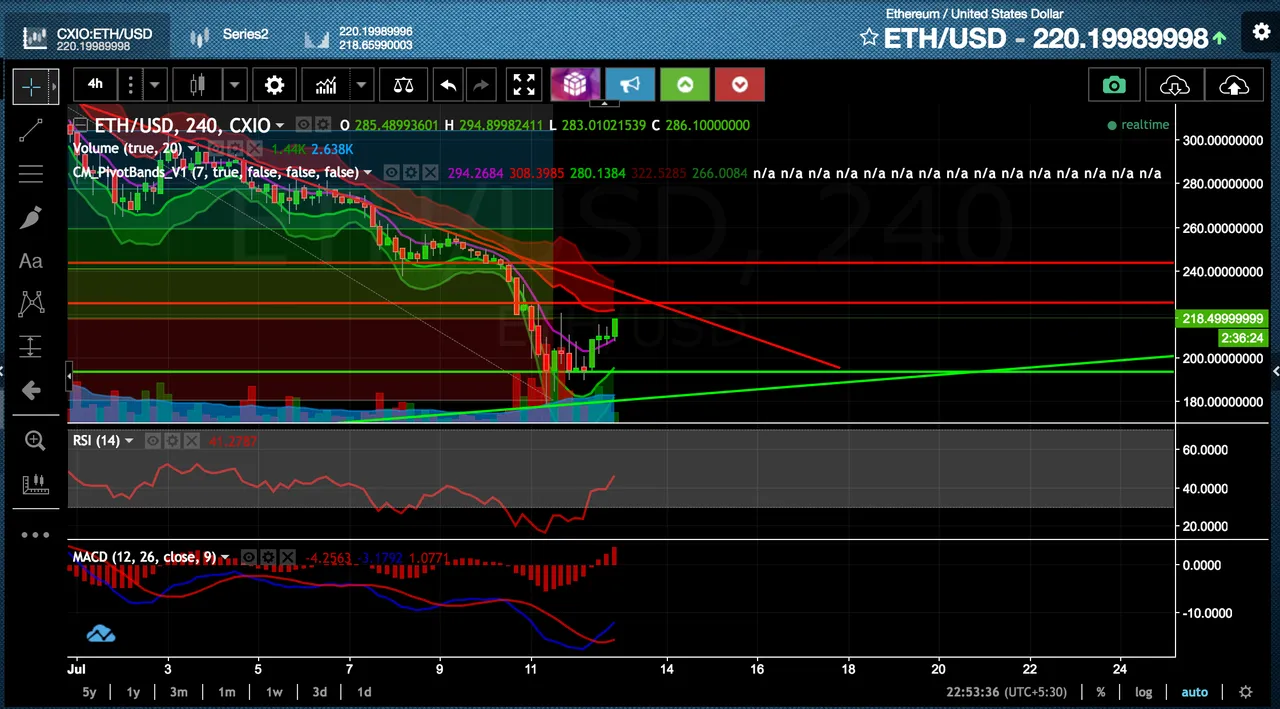
- On 4-hourly price chart, MACD is still in bearish zone facing upwards with RSI under 50 level.
Key Highlights :
- Early sign of recovery on hourly price chart of ETH/USD pair
- Still lot of resistances present on the way to bullishness
TBH: I took LONG position at $212 with my Risk management in place. ( I took entry after seeing the price close above pivot line with confirmation of MACD and RSI on hourly chart) Update: => and next candle went to $222
UpVote if you find it helpful, Resteemit to spread the words, Follow Me for more updates and cryptocurrency technical analysis.
Join My Channel at Telegram to get Trading Signals : Crypto Trading Technical Analysis