In this article we are going to compare four projects in terms of the distribution of their respective tokens. The projects are Augur, Civic, EOS and VeChain. We are going to show what is the weight of big and small holders in the total token distribution.
We value your peer-review. Let us know about points we might have missed, all feedback is welcome.
Motivation:
We often hear that a good functioning governance relies on a healthy distribution of the project shares. This makes sense as in decentralization, otherwise decisions may end up being taken by a minority holding large amount of shares. This is not necessarily a bad thing, big investors are likely to seek the best decisions since they are so heavily invested. However, aggregating different opinions and perspectives is known to result in better overall decisions (i.e wisdom of the crowd).
Data:
For all the four projects we accessed the lists of all token holder address data from the Etherscan.io website [1].
Method:
- For each token distribution, we sort the token holding addresses from poorest to the richest.
- Then, starting from the poorest address, we calculate the cumulative sum of tokens as we continue down to the richest address.
- We plot this cumulative sum (on the vertical axis) against the current address' balances (on the horizontal axis).
- To make the curves comparable we divide the cumulative sum and the address balances to the total token supply of each project. In this way all values become ratios of total token supply.
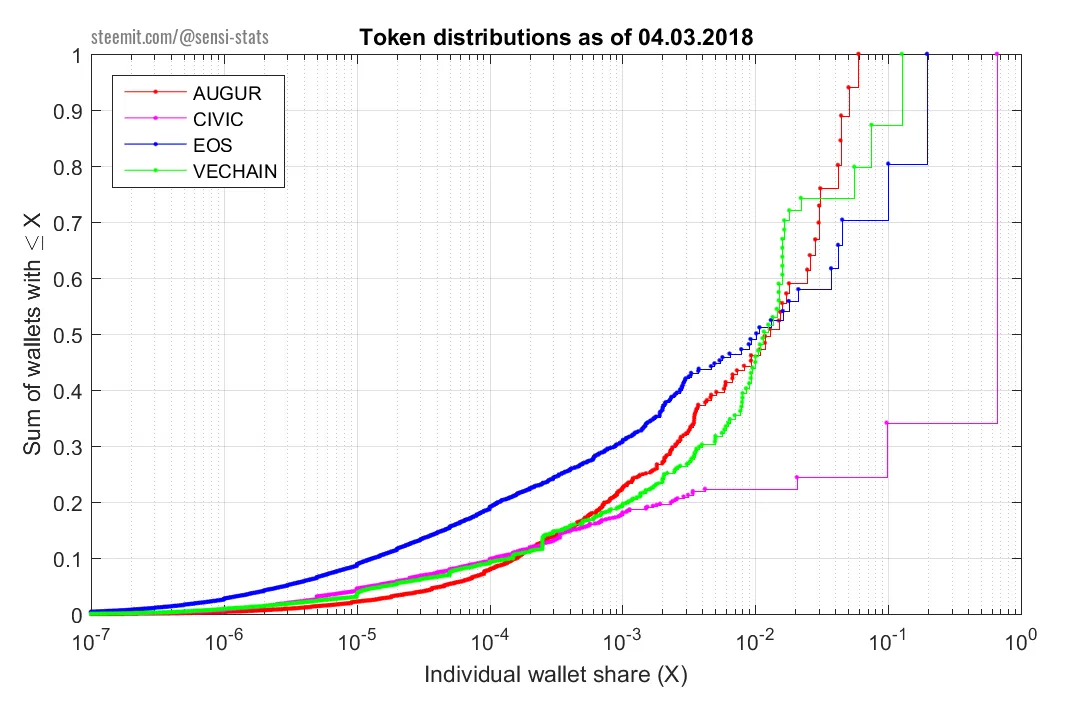
In this way, each point (X,Y) on the curves shows the ratio of project shares Y held by addresses having X or less.
For example: we see that all curves (except Civic) intersect roughly at (X= 0.01, Y= 0.5) meaning that 50% of all the tokens are held in wallets each with less than 1% of the total supply.
Interpretation:
- Civic is the most centralized distribution among all four. With 66% held by the project [2] and a single address holding 1/3 of the remaining 33% sold in the token sale.
- For Augur the richest address holds the least amount (5%) of all tokens. Although, for comparison, we should keep in mind that the EOS distribution is still going on. The richest EOS address that holds 20% of all tokens will be gradually emptied by the end of the distribution (end of June).
- In terms of broadness of the distributions, EOS is more widely distributed among wallets with small amounts. We see this for wallets holding from 0.00001% to 1%. These wallets' contribution to the total sum is consistently larger when compared to the other distributions. This may be attributed to the novel distribution method that auctions a fixed amount of tokens on a daily basis [3].
Limitations:
Here we summarize some of the limitations that might affect the interpretation of the data analysis
- Users with multiple wallets: If users are holding their tokens in several wallets with different addresses this will show up as an artificial spread in our distribution analysis. However, since we are comparing several projects relatively to each other, unless users of some projects tend to create more multiple wallets than other projects, we do not expect this effect to change our relative interpretations
- Large exchange addresses: Users might keep their tokens on exchanges and hence they would appear under a single large address. Thus if a token has a higher trading volume it will tend to appear artificially more centralized due to the large exchange presence.
We value your peer-review. Let us know about points we might have missed, all feedback is welcome.