I would like to share my data analysis of the EOS ICO. The ICO has been running for two days, so there is plenty of data for making some projections about the final price of the EOS token for this time window. However, please understand they are just speculations based on the current trends visible in the data. The real final price may be very different for example if the trends change or some other unexpected event arrives.

The whole analysis was done using a script I made which you can find here on github, so you can take a look and play with it if you want. I also welcome pull requests if anyone of you wants to extend the analysis further.
The analysis has three steps:
- Inspect all transactions sent to the EOS ICO ethereum account
- Find a good model for final price projection
- Look at how EOS tokens are distributed between accounts
The Model and the Projection
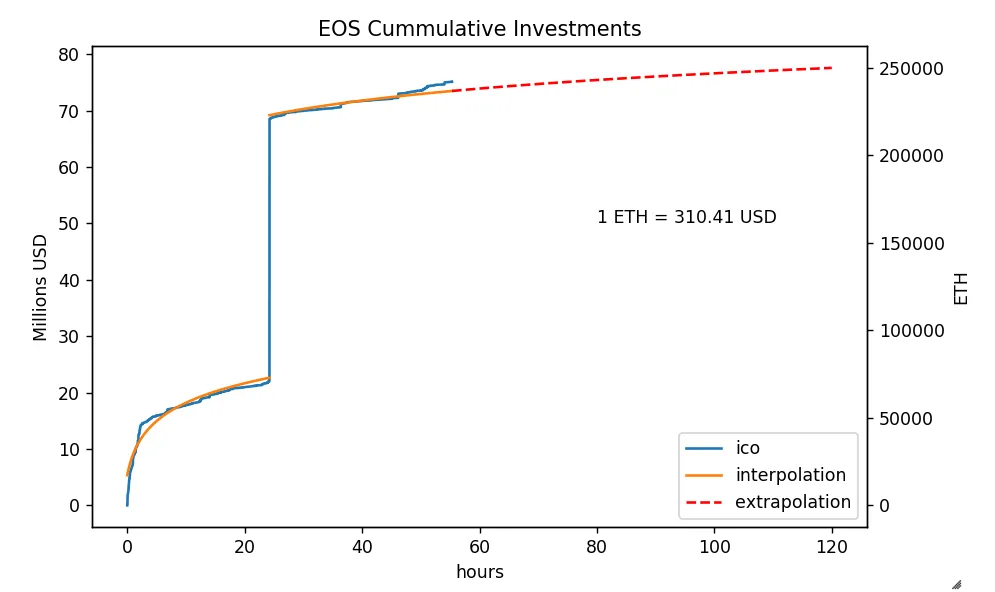
Now to the actual analysis. On the figure below you can see the cummulative amount of all ETH sent to the ICO (blue line). The big jump which happened around 24 hours after the start of the ICO looks like the investment from Yunbi exchange, which was announced by @dantheman on Telegram in advance (although it is 150k ETH instead of 120k). When not taking this single investor into account the trend seems to follow a logarithmic curve (orange line). Which makes sense for me, because this ICO is designed as a price discovery mechanism and it seems to be converging to the final price as less and less investors are contributing.

The final projection is the red dashed line which goes towards the amount of 250k ETH at the end of this ICO window, which means the price of 0.001250 ETH per EOS. The logarithmic curve was a surprisingly good fit for the data up to until around 5 hours ago. Since then there is some visible uptrend which might be connected to the recovery of ETH price. People making profits are usually looking for places where to reinvest them and EOS might look like an appealing destination. I am curious to see how the trend unfolds.
Token Distribution Between Accounts
Token distribution is a very important factor for each blockchain, because decentralization makes sense only when the influence of it's shareholders is distributed and not centralized in the hands of a few. Also the fair distribution was one of the main goals of this ICO, so let's see how it looks.
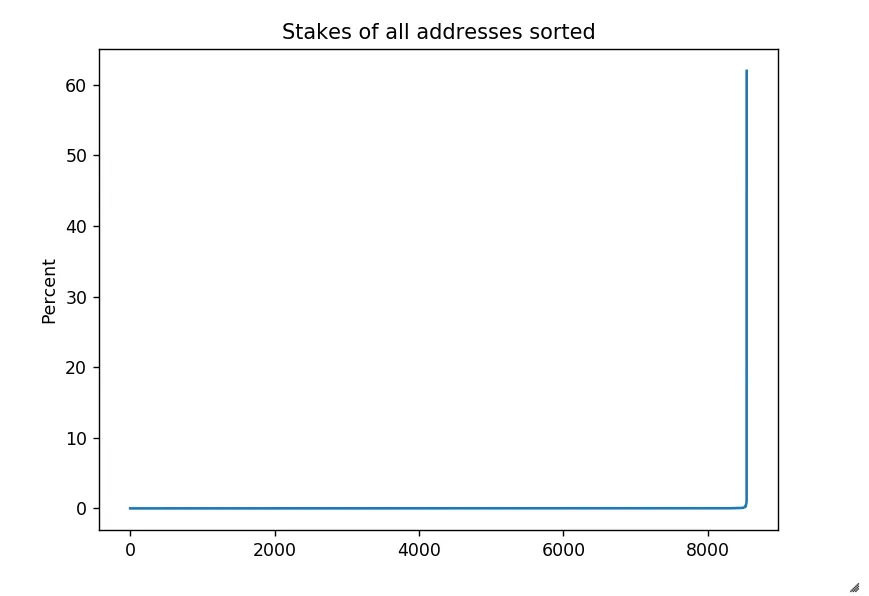
From the first figure it was visible that a major investor took part in this ICO. Their stake currently accounts for almost 62% of all ETH collected. On the following figure you can see how huge this investment is compared to all others.

If we leave out this whale and look at the other top 100 accounts participating in the ICO, we can see a familiar power law distribution. The second biggest investor is at 1% of all stake.

The rest of the accounts and their stakes follow the same curve:

I'll wrap up with some interesting statistics:
Number of addresses taking part in the ICO: 8538
Amount raised: 75,157,924.99 USD / 242,122.59 ETH
EOS price: 0.3758 USD / 0.001211 ETH
Predicted EOS price: 0.3880 USD / 0.001250 ETH
As a future work I am planning to analyse the rest of the 351 auction windows.