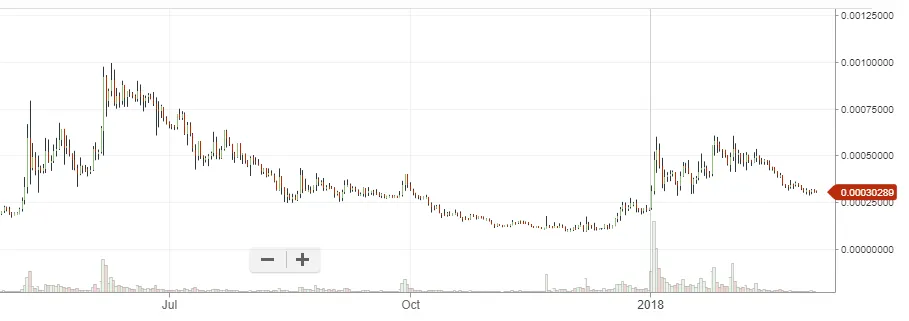
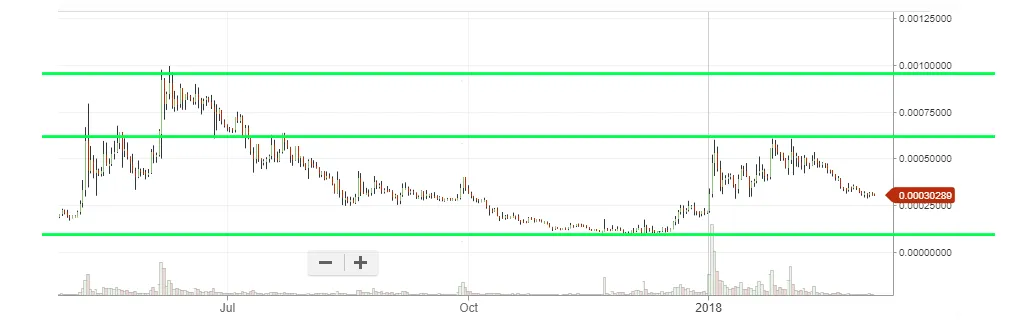
Charts are historical price ranges, got it? Short or long-term, your choice. Take for example, BTC-Steem's daychart:-
Okay, Bob. Now draw a line now across the chart. But what line, you ask? Just draw something. Try it!
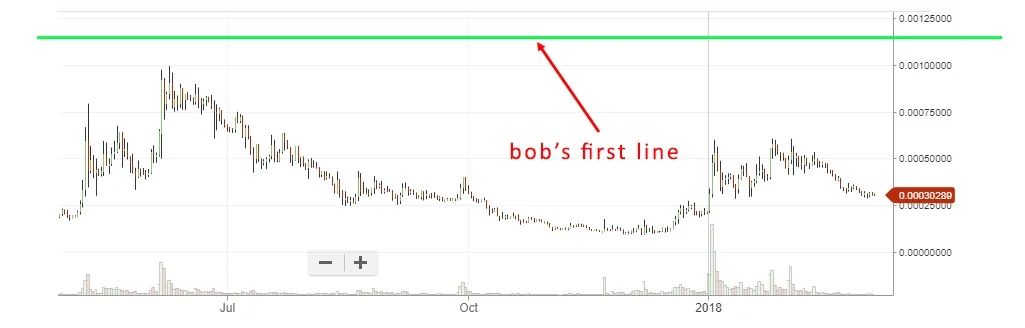
Okay, Bob. Nice line. But why did you draw it there? Try again. Make some sense into your damn line.
Nice, Bob. Now you're getting somewhere. You just drew your line at the highest price point of BTC-Steem over the period of about nine months. I'm proud of you!
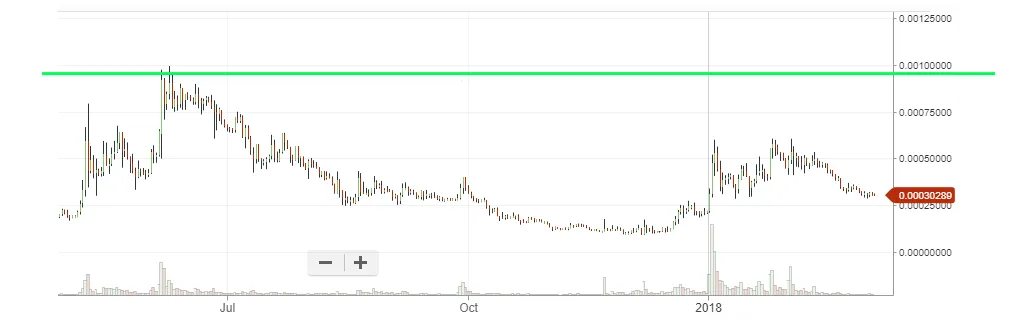
What? You're not sure if you should draw it at 0.000985, 0.000989, 0.000999, 0.00100, or 0.00111 instead of the line you have at 0.000975 now? Look, I'm not a scientist and quantum mathemagician. It's up to your taste in lines. Now Bob, what's the opposite of highest? Draw your next line.
Splendid, Bob. You see, if enough people believe in these lines, you can expect prices to have good chances to react when price reaches these lines. It's best to think of these lines as sponges. Because not everyone draws the exact same lines.
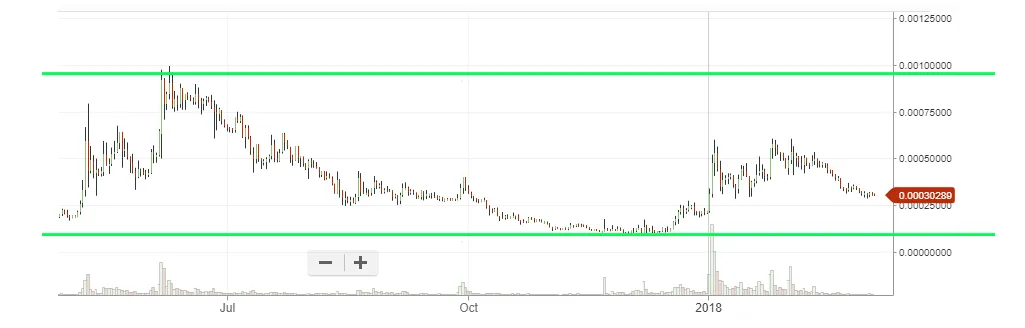
Now, try to draw a line somewhere in the middle. Use some common sense.
Amazing, Bob! You've connected some nice dots. Let me show you.
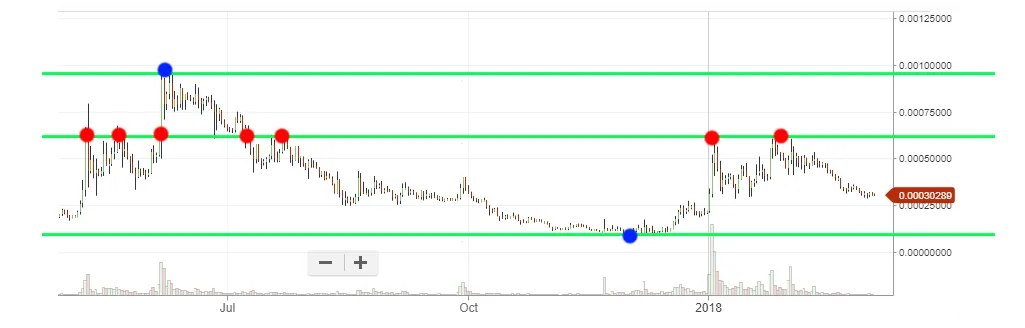
The blue dots just indicate the maximum and minimum price points, hence they're not connecting any dots (although they might). Now, the red dots are the local-maximums and / or local-minimums. You've connected quite a few, so that's great. You're quickly becoming a great line drawer, Bob.
Try another one.
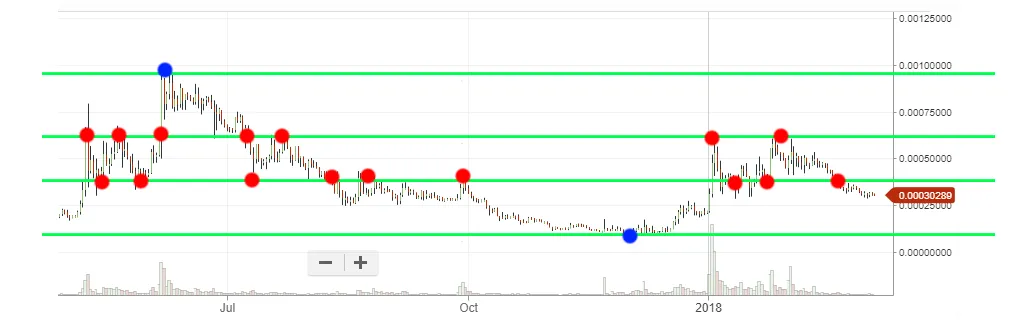
Phenomenal, Bob. Maybe I should call you master Bob soon. What? You're not so sure about the new line since there are sticks jutting out and doesn't look so elegant? Bob.. bob. Remember that the line is a sponge. It's squishy. Don't worry about it. You can draw more lines too if you want, zooming in and out, with different timescales. Even with diagonal lines if you so fancy. But your chart will quickly get cluttered with lines and you'll have to decide whether or not to buy or sell at 0.1, 0.11, 0.111, 0.1111, 0.12, 0.121, 0.12111 or whatever. You get it.
Okay now. If you're desperate and really want to get some Steem right now and profit in the future, these lines are your own guide. Choose a line. Where will you sell?
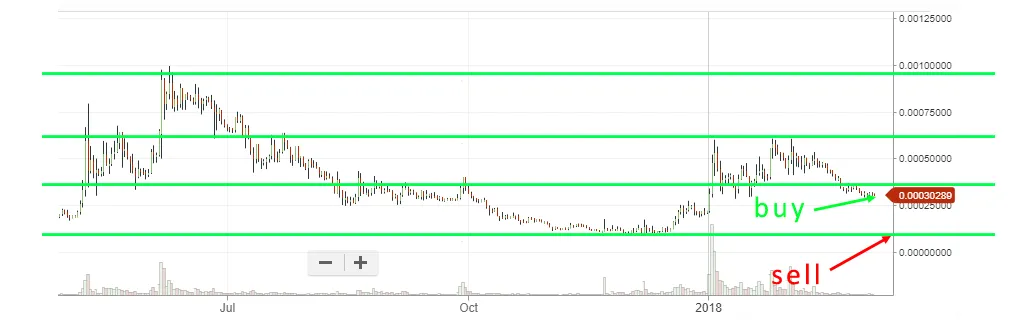
Yes, Bob. That's exactly how you make money. Now give me $200 for the crash course. I won't teach you anymore because that's all you really need for the rest of your life. I'm a simple man. I just buy stuff I believe in and hold long term. No lines needed (well, except to buy low, but why a line again?)
#savetheinternet
#supportcurationworks
#steemsalvation