Ecency is probably the most comprehensive Hive dApp with a web site, desktop application and a phone app. And from just a few days ago a new app for short form posting called waves. Its phone app is the most used app for a general Hive experience with notification system and all. They have a relatively easy sign-up process and creating Hive accounts with just a mail verification.
Ecency has been around for a long time, and it has went trough a process of rebranding when the Hive fork happened from its previous version eSteem. Ecency has been building for years with no hype around the app, but just providing a nice experience, especially on the mobile side.
Let’s take a look at some of the data.

Here we will take a look at the activity on the platform, the overall number of posts, comments, and the number of users. The top content creators for the last month will be presented as well.
The period that we will be looking at is from the creation of the app on Hive, August 2020 till now.
Posts
First let us see the number of posts coming from the Ecency.
Here is the chart.

We can see that at the start the app was not heavily used but then it grew by a lot, especially in 2021. The all time high for daily posts has been at the beginning of 2022, where there was 1k post per day. Since then, the activity dropped but not as much.
The activity on the app was sidewise for a long time in the range of 600 to 800, then it dropped slightly and we are now around 500 posts per day.
Comments
The chart above was only about posts.
What about comments?
Here is the number of comments made per day from Ecency.
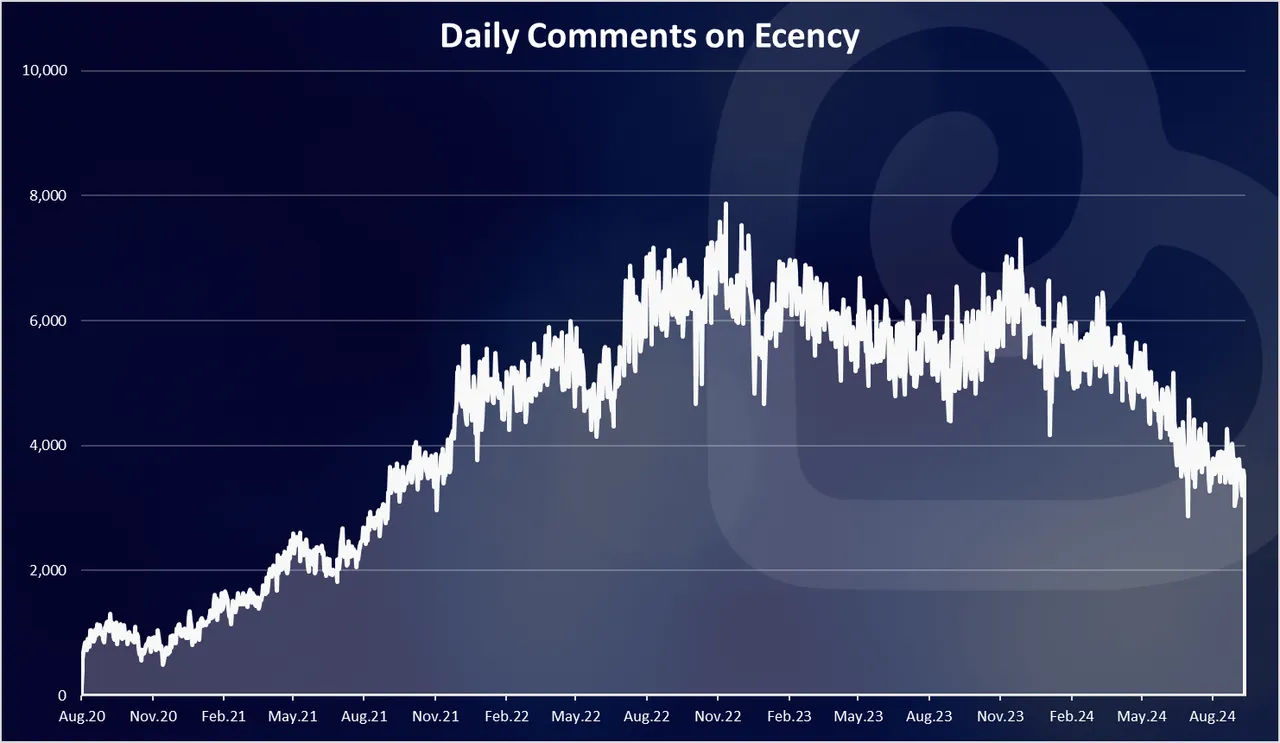
The growth in the numbers of comments has been even more significant then the posts. From 1k at first to 8k at the top in October 2022. A slow drop from then to 5k in August 2023, and a rise again towards 7k in December 2023. In 2023 the number of comments has dropped and in the las period the number of comments are around 4k daily.
Posts and Comments`
When we combine the posts and comments on one chart we get this.
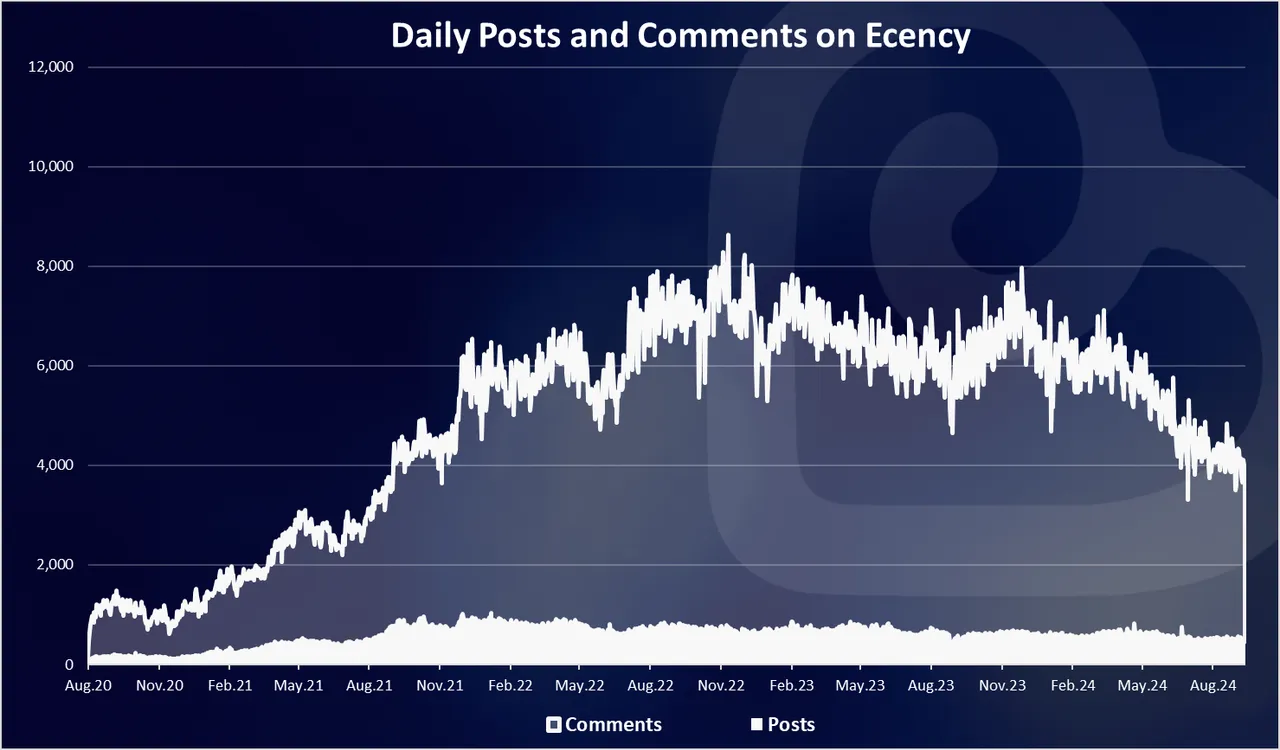
This chart si mainly driven by the comments, since their number is higher. We can see the top for the numbers of posts and comments are not aligned. The ATH for posts was at the being of 2022, while the ATH for comments was at the end of 2022. This is where the overall activity was highest with 8.5k posts and comment made per day back in November 2022.
We can notice the recent spike balc in November 2023 when the overall activity reached 8k, close to the previous high, most likely becouse of the intrudction of waves.
When we polot the numbers on a monthly timeframe we get this.

A growth up until August 2022, and almost constant numbers since then. A very small decline in the overall acitivity on Ecency even though it has been a hard year for the crypto prices.
In the last months the numbers are around 140k monthly posts and comments.
Authors
How about the numbers of the authors on the Ecency. How many accounts are posting?
Here is a chart for the monthly numbers of accounts posting.
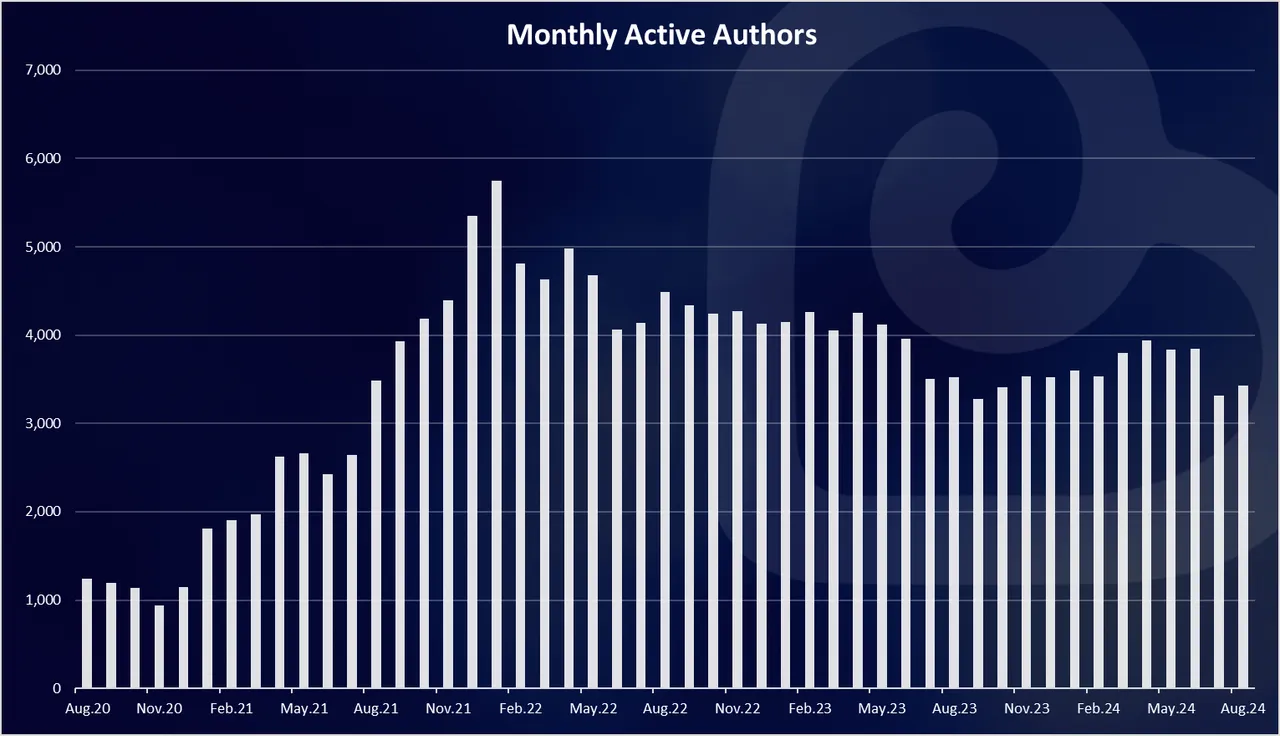
After the initial growth back in 2020 and 2021, in the period after that we have almost constant numbers of MAUs on Ecency. There has been around 4k MAUs for a long time, then a drop in July 2023 to 3.5k. Since then, the numbers have been sideways in the 3.5k to 4k MAUs.
Next the number of unique authors that posted from Ecency. These are authors that posted directly through the frontend.

The number of unique Ecency authors is showing continuous growth.
There is a close to 33k unique authors that have used Ecency to post. In 2024 there has been 5k new unique authors trying the frontend for the first time. Back in 2023 there was 4.5k new accounts.
Authors that Posted the Most
Here is the rank of the authors that posted the most in the last 30 days.

The top accounts have posted more than 100 posts in a month from Ecency, while the once on the bottom of the chart are with around 50 posts.
What about comments? Here is the chart.
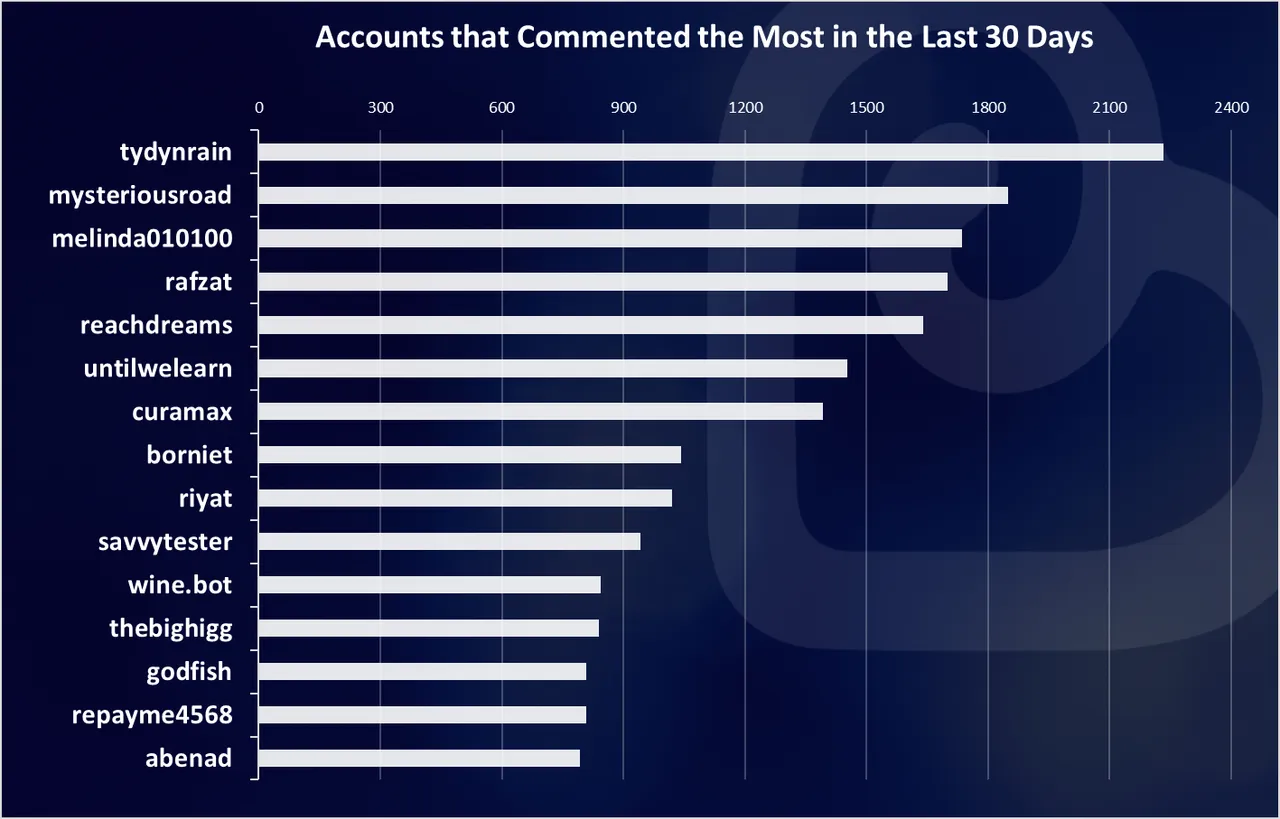
More than 2k comments per months from the top commenters.
Overall, we can see that there has been a small decrease in the activity coming from Ecency with almost constant numbers for activity and users in the last year. Around 4k MAUs for Ecency making around 500 posts daily and 4k comments.
All the best
@dalz