A couple of days ago, I made part 1, which is a 3D visualisation of where Steemit users are located. It was a lot of fun because it was also the first time I used PowerBI - a fantastic tool for data visualisations. Check out part 1 here: https://steemit.com/blockchainbi/@remuslord/where-are-all-the-steemit-users-around-the-world-oc
@plushzilla pointed out that it would be better to see the data on a normal map and perhaps across time. So that's what I've done here!
Since Tableau has an excellent (or good enough) location aggregator, and with some manual categorising I've managed to increase the number n of users in this analysis to around 170,000 from 30,000(!)
170k is about a 3rd-4th of the entire Steemit user base! So I think we've got an excellent approximation of the geographical distribution of users. I still think North America is underrepresented in the data because of the lower likelyhood of US users including US or USA. I tried to include some of the largest states manually.
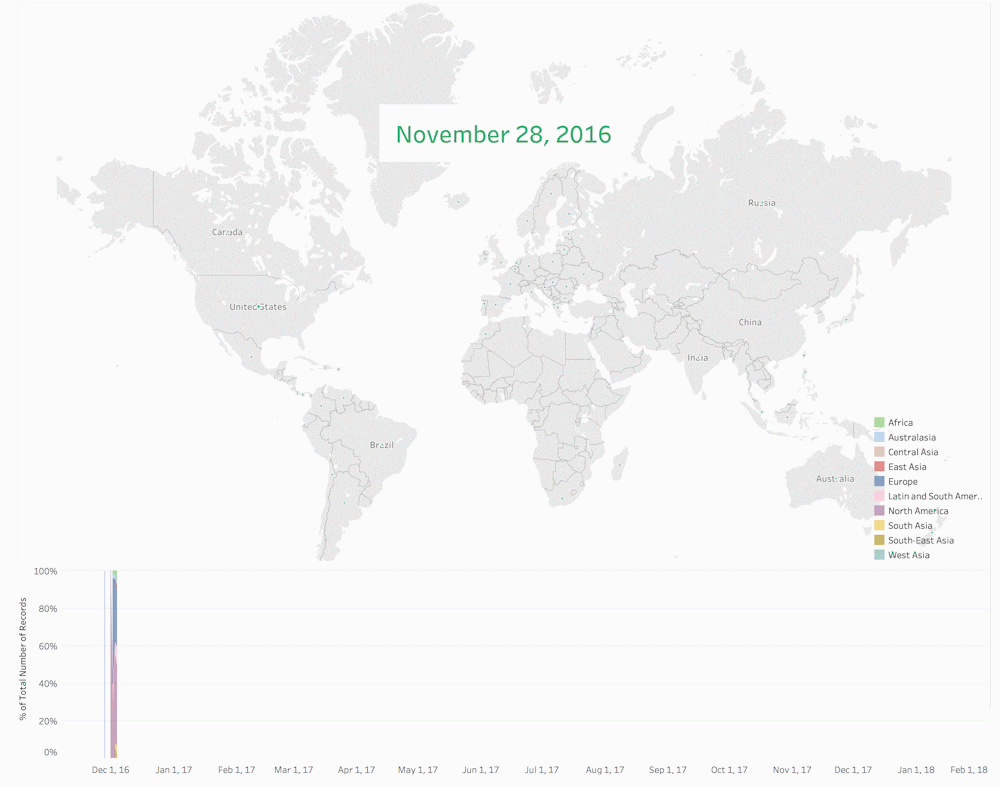
Here is a gif of the accumulation of daily user profile updates to location (IMO a very close proxy to user registration). *I made it interactive, but Tableau Online is too sluggish on such a big database so that spoils the fun. Please let me know your feedback if you can spare a minute :)
You can watch the video in HD here: !
And the static graphs with comments:
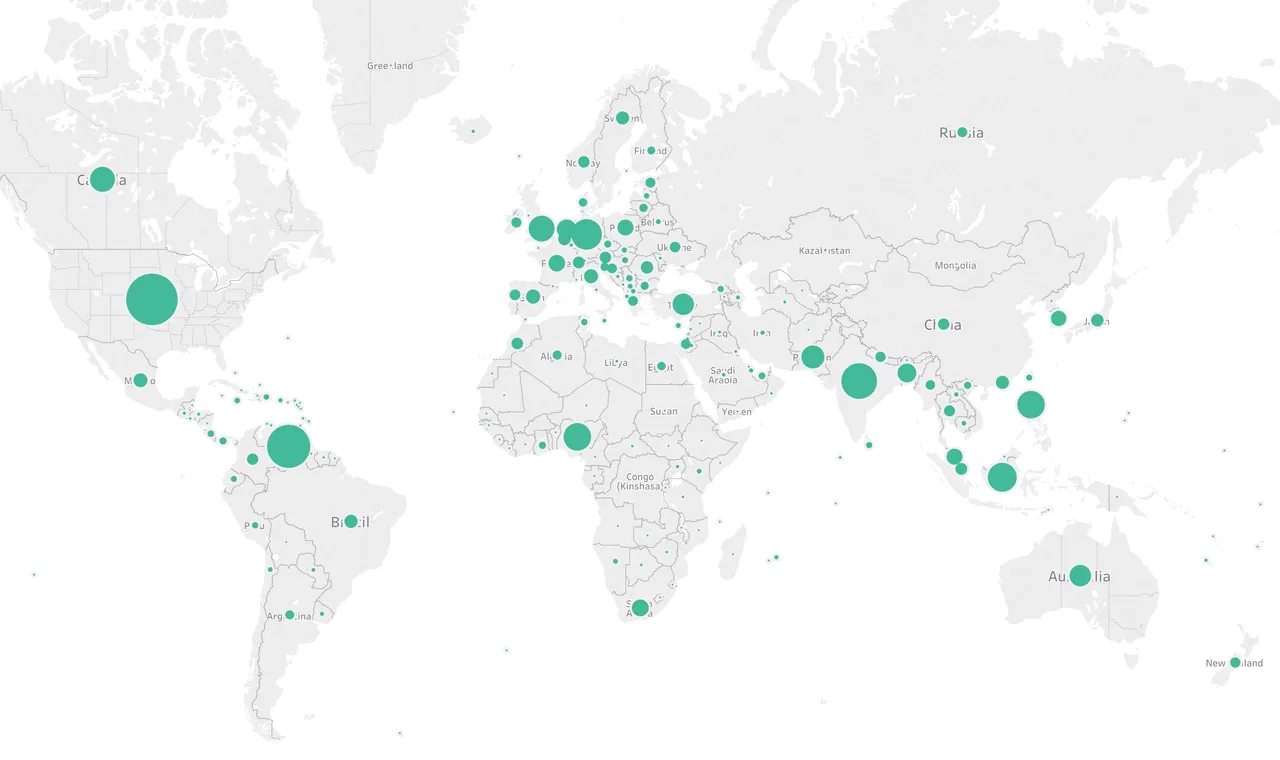
Today's user base distribution: The map shows a relatively broad distribution across the world with pockets of popularity in North America, Europe, Nigeria, Venezuela, India, Malaysia, Indonesia.
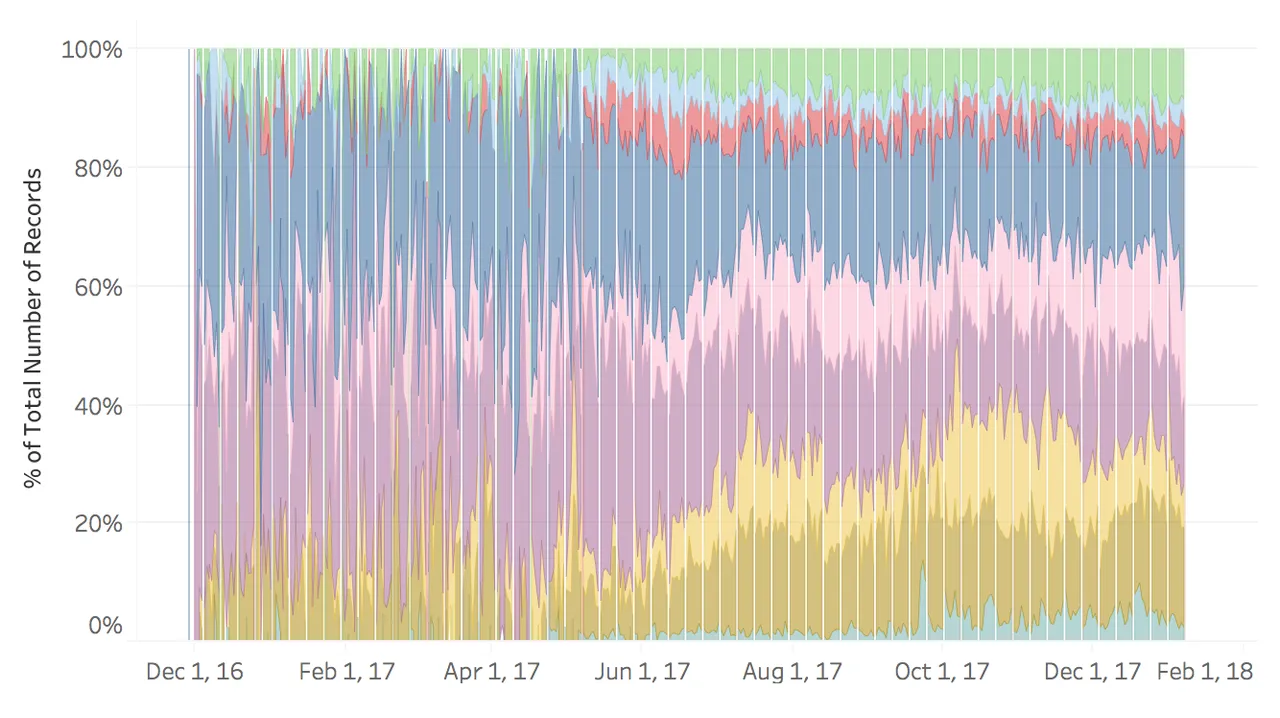
Although the data for user updates seems to be jittery before June 2017, the user base is clearly dominated by North America and Europe. Over the last 6 months we see a globalisation of steemit, and the rest of the world is catching up.
Let me know what you think!
Thanks for reading :) Happy steeming! _
PS: Big thank you goes to @arcange for providing development of the SteemSQL database that was used for this visualisation.