Crypto Contest September 24: FLO
FLO (Bittrex: FLOUSD) has broken out of the triangle pattern in the weekly chart.
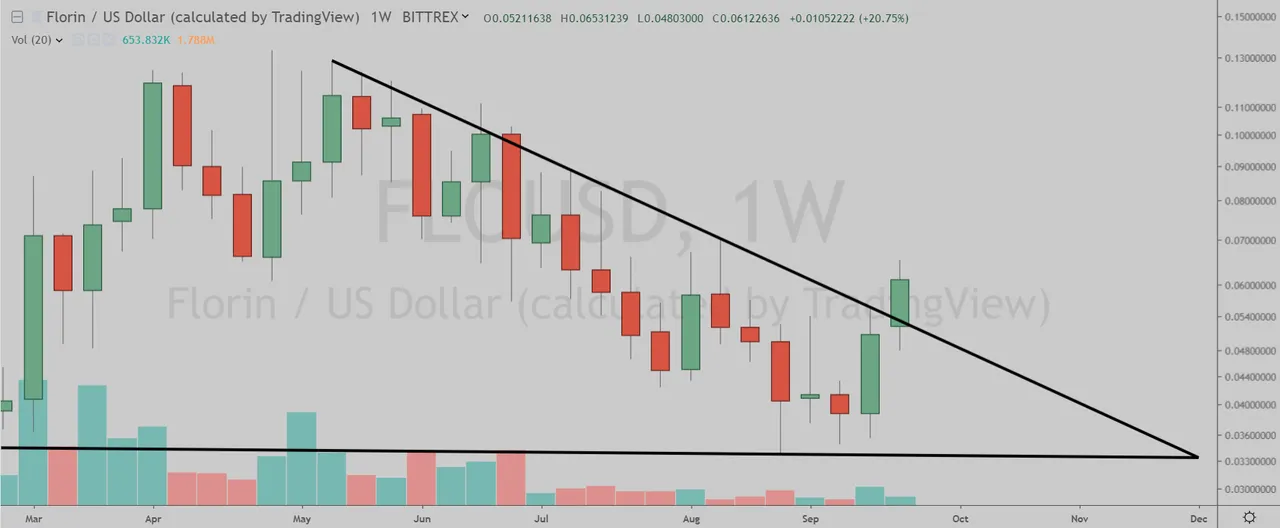
(Chart courtesy of Tradingview.com (log scale))
Elliott Wave Analysis
In Elliott Wave terms, FLO began a wave one advance in November 2018. The red wave one (blue sub-waves i-ii-iii-iv-v) finished in April this year, and the red wave two (blue sub-waves a-b-c) correction ended in August. If this wave count is correct, FLO should be heading next towards the April peak in the red wave three.
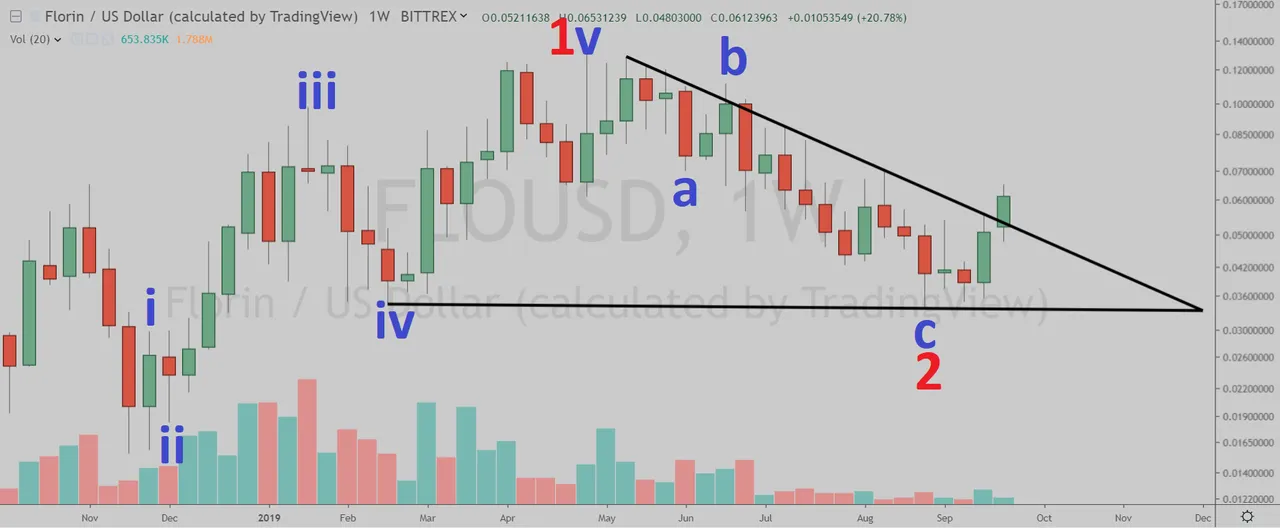
(Chart courtesy of Tradingview.com (log scale))
Looking at the monthly chart, I believe FLO is currently in the red wave three (blue sub-wave iii). The red wave three began in November 2018.
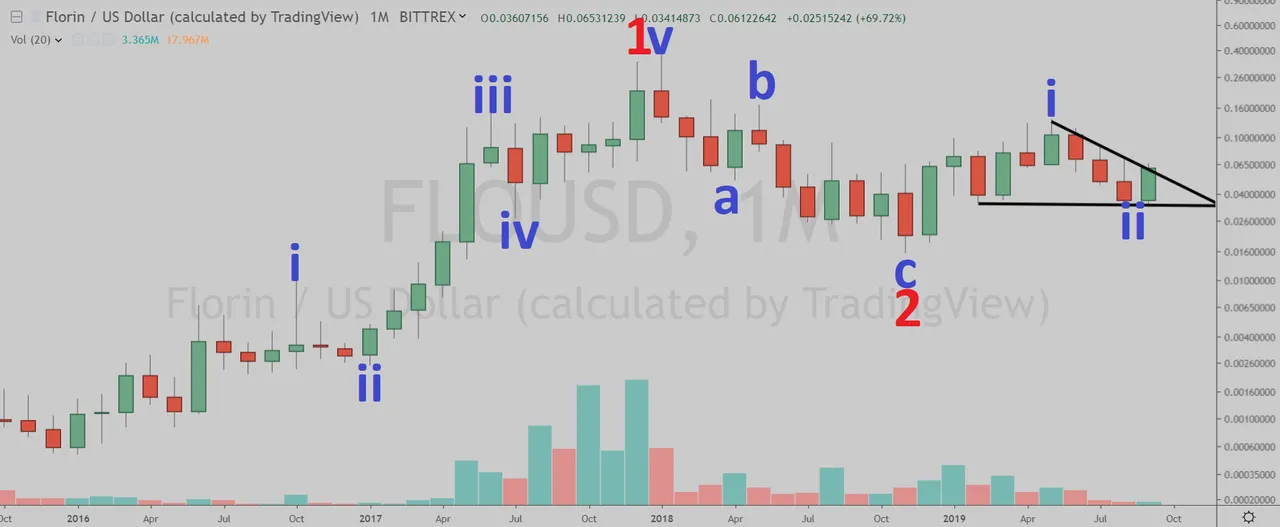
(Chart courtesy of Tradingview.com (log scale))
Funnymentals
FLO is a public record for building decentralized applications that introduces a new feature called floData. Crypto Love interviewed one of the developers last month.
(Sources: https://www.flo.cash/)How Will FLO Trade?
FLO (Bittrex: FLOUSD) daily chart by Tradingview.
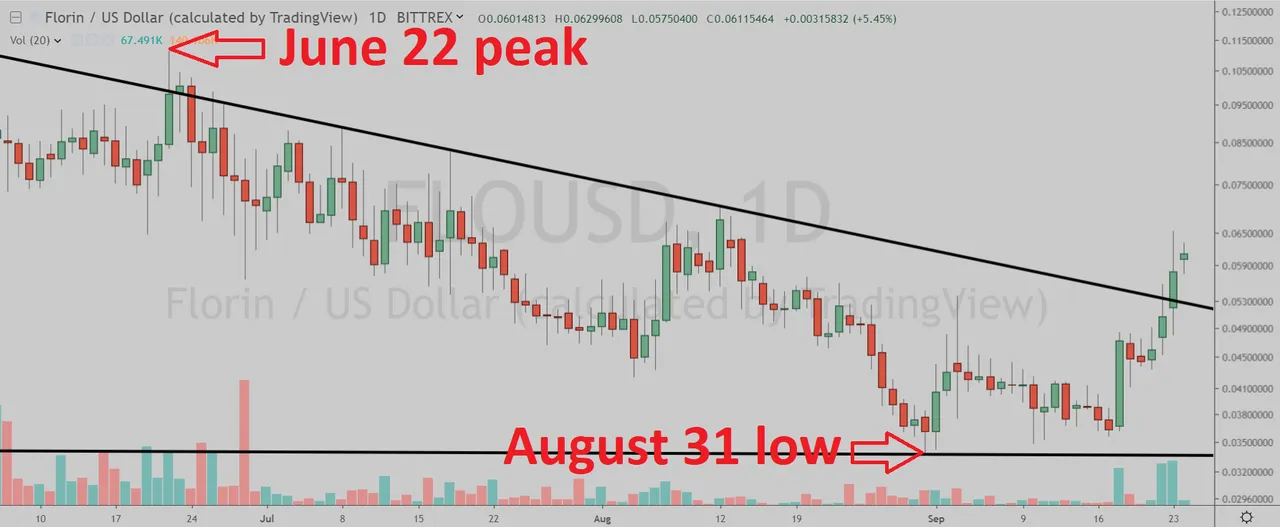
(Chart courtesy of Tradingview.com (log scale))
Prizes
I will be giving upvotes to the correct answers with minimum reputation of 25.
Rules
This poll will expire in one week. Only one vote per person.
Which one will happen first?
Please select one of the three choices.
- FLO will takeout the June 22 peak
- FLO will drop below the August 31 low
- FLO will stay in a trading range between the August 31 low and the June 22 peak until October 30
Answer the question at dpoll.xyz.