Crypto Contest February 10: Factom
Factom (Bittrex: FCTUSD) has broken out of the triangle pattern in the weekly chart.
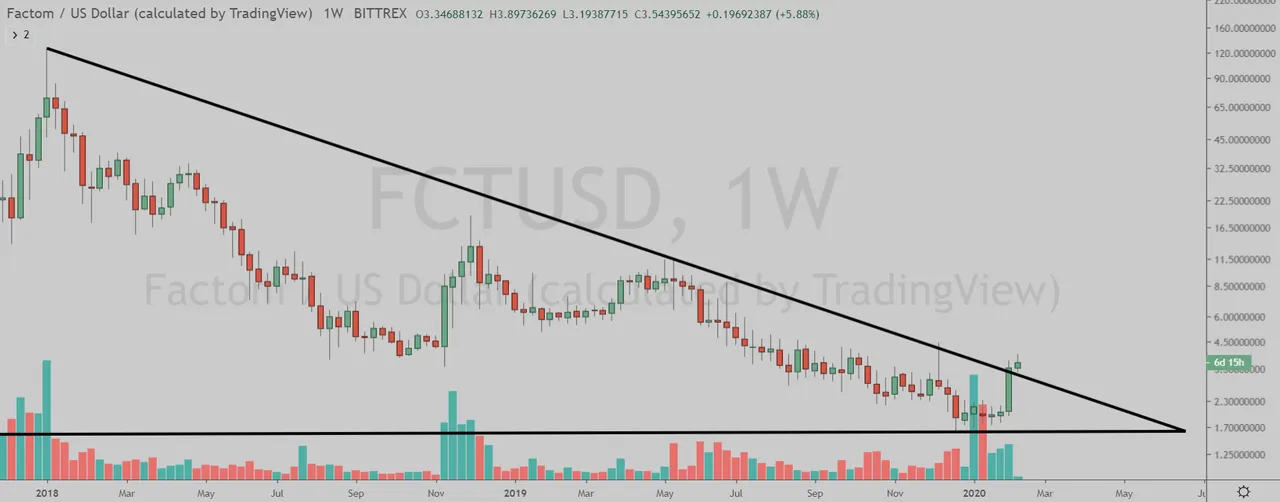
(Chart courtesy of Tradingview.com (log scale))
Elliott Wave Analysis
In Elliott Wave terms, FCT began a wave one advance in June 2016. The red wave one (blue sub-waves i-ii-iii-iv-v) finished in January 2018, and the red wave two (blue sub-waves a-b-c) correction ended in December 2019. If this wave count is correct, FCT should be heading next towards the January 2018 peak in the red wave three.
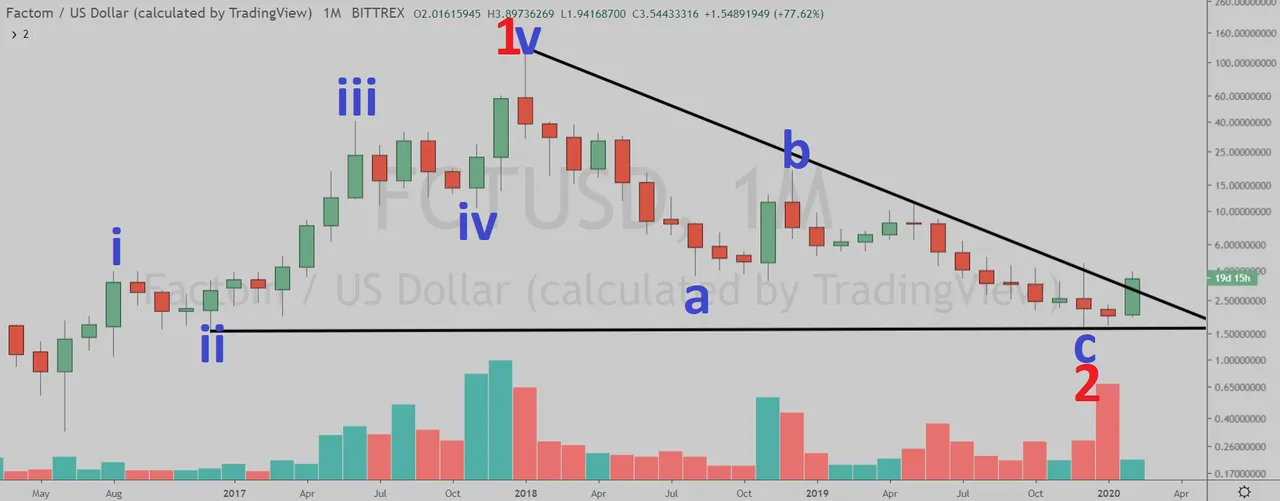
(Chart courtesy of Tradingview.com (log scale))
Funnymentals
Factom is an enterprise grade, developer friendly platform to efficiently build blockchain solutions. Coin Bureau reviewed the project back in July 2019.
(Sources: https://www.factomprotocol.org/)How Will Factom Trade?
Factom (Bittrex: FCTUSD) weekly chart by Tradingview.
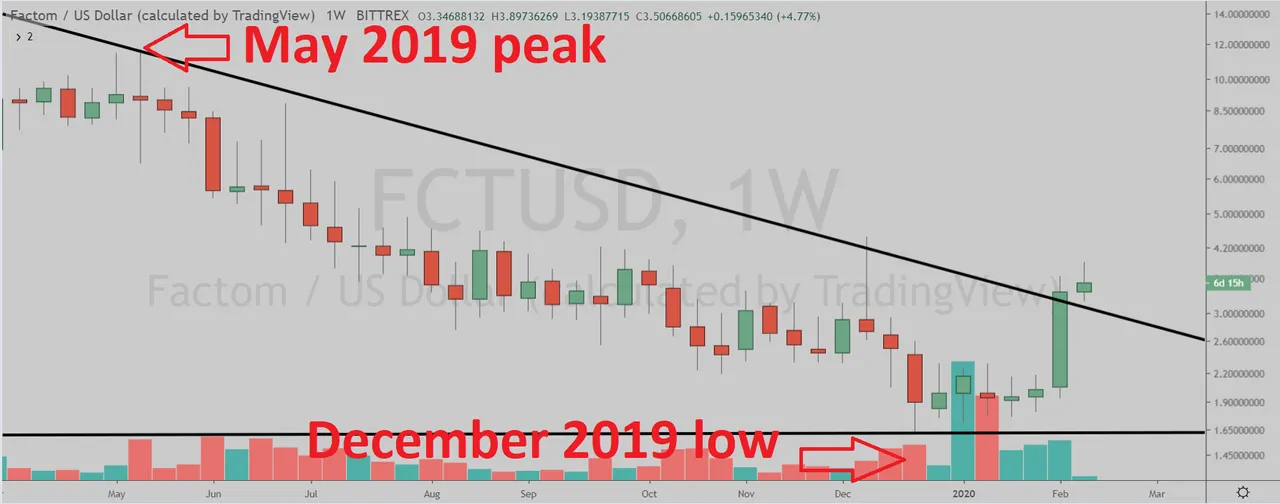
(Chart courtesy of Tradingview.com (log scale))
Prizes
I will be giving upvotes to the correct answers with minimum reputation of 25.
Rules
This poll will expire in one week. Only one vote per person.
Which one will happen first?
Please select one of the three choices.
- FCT will takeout the May 2019 peak
- FCT will drop below the December 2019 low
- FCT will stay in a trading range between the December 2019 low and the May 2019 peak until March 16
Answer the question at dpoll.xyz.