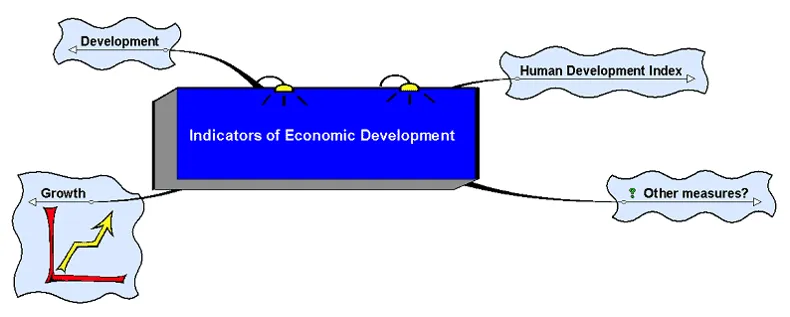
Economic growth!
Using measures of economic performance in terms of the value of income, expenditure and output
GDP – Gross Domestic Product
The value of output produced within a country during a time period
GNP – Gross National Product
The value of output produced within a country plus net property income from abroad
GDP/GNP per head/per capita
Takes account of the size of the population
Real GDP/GNP
Accounts for differences in price levels in different countries
Origin of HDI:

The index was developed in 1990 by Pakistani economist Mahbub ul Haq and Sir Richard Jolly, with help from Gustav Ranis of Yale University and Lord Meghnad Desai of the London School of Economics

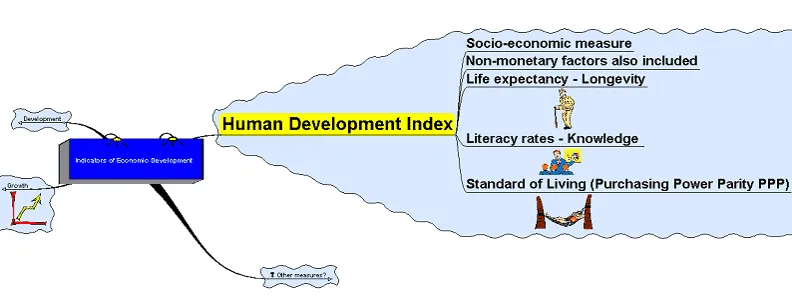
Dimensions of HDI
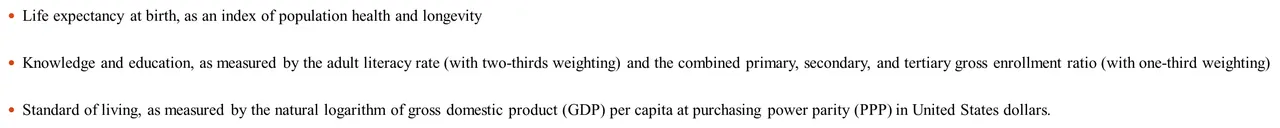
Life expectancy at birth, as an index of population health and longevity
Knowledge and education, as measured by the adult literacy rate (with two-thirds weighting) and the combined primary, secondary, and tertiary gross enrollment ratio (with one-third weighting)
Standard of living, as measured by the natural logarithm of gross domestic product (GDP) per capita at purchasing power parity (PPP) in United States dollars.
To construct the index, fixed minimum and maximum values have been established for each of these indicators:
Life expectancy at birth: 25 years and 85 years
Adult literacy rate: 0 & 100 %
Combined gross enrolment ratio: 0% & 100 %
Real GDP per capita (PPP$): $100 & $40,000 (PPP$)
Individual indices can be computed according to the general formula:
Index = Actual xi value – minimum xi value/
Maximum xi value – minimum xi value
For eg: the life expectancy at birth in a country is 63.7 years the index of life expectancy for the country would be:
Life expectancy index = 63.7-25/85-25 = 40/60 = 0.645
The adult literacy rate is 61.0%.
Adult literacy index =61.0-0/100-0=0.61
Combined gross enrolment ratio is 63.8%
Combined gross enrolment index
=63.8-0/100-0=0.638
Education index=2/3(0.61)+1/3(0.638)=0.62
Real GDP is 3452,then adjusted GDP
=log(3452)-log(100)/log(40000)-log(100)=0.591
Therefore HDI for India= (0.645+0.62+0.591)/3 =0.619
High Human Development Index – HDI 0.800 and above
Medium Human Development Index – HDI 0.500 to 0.799
Low Human Development Index – HDI below 0.500
Relationship between individual development and human development in general
If two people in a relatively unequal society have an HDI of 0.5 and 0.25, respectively, and both increase their level of development by 0.25, they will affect general development in the same magnitude.
In a more equal society, however, an increase
in the HDI of the poorer person should count more.
Limitations of HDI:
Not a comprehensive measure of human development. It only focuses on three dimensions of capabilities.
The HDI is not designed to assess progress in human development over a short-term period because two of its component indicators—adult literacy and life expectancy at birth—are not responsive to short-term policy changes.
Like any average country measure, the HDI does not account for variations in human development within the country.
Countries with the same HDI may be very different in how human development is distributed, either from region to region, or from social group to social group.