
SUMMARY
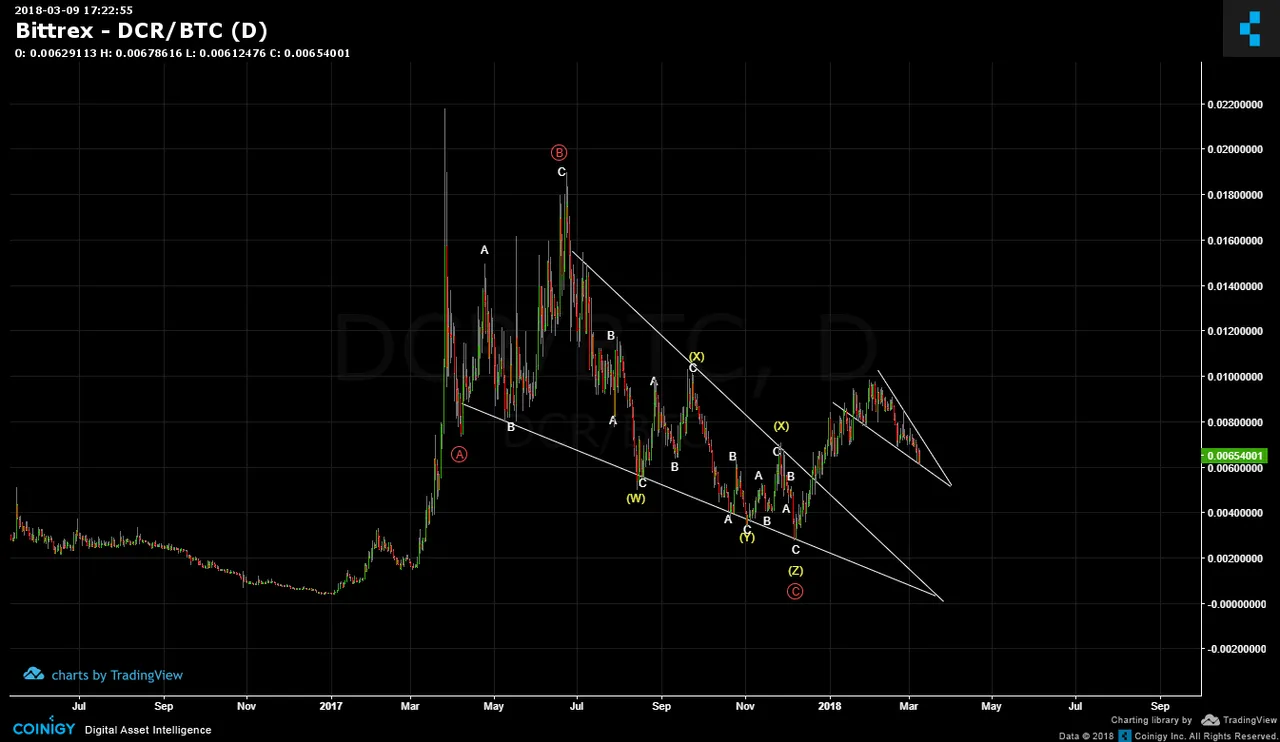
DECRED (DCR/BTC) correction had started all the way back in March of 2017! Per the below chart, that correction took nearly 9 months...talk about a flawless and extreme execution of the "Hurry & Wait" Altcoin Syndrome! The overall correction can be mapped as an ABC (red) where each subdivides to qualify the labels. The red C is complex in count with wxyxz triple. When price broke out of the upper white wedge line, it was a bit far away from the Apex whereas a more proximal distance usually signals more bullish trend reversals. The smaller wedge fractal can also has future price pathway implications.
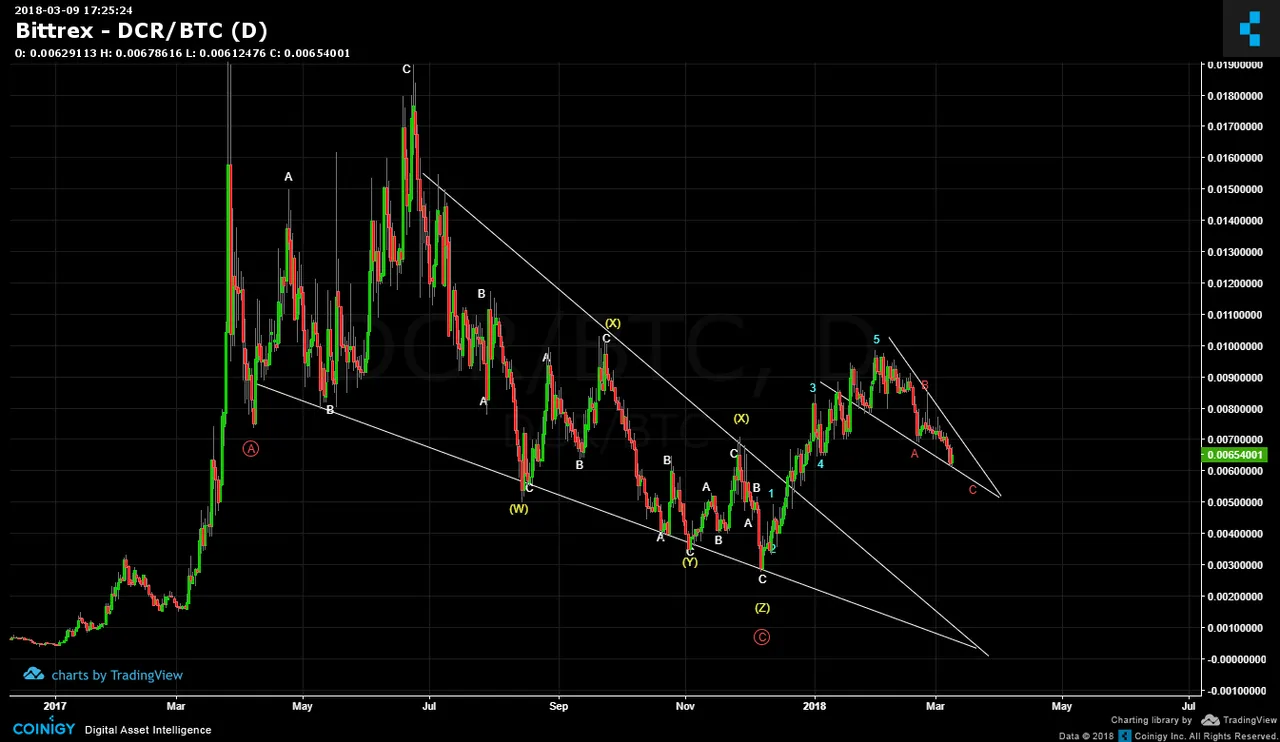
The blue impulse waves show that the breakout was likely genuine and the smaller wedge is marking an abc decline. The blue waves become subwaves to a higher degree wave 1 and the abc subwaves to a higher degree wave 2. IF this count is correct, then wave 3 up should be signaled to be next with a seconf round of impulse motive.
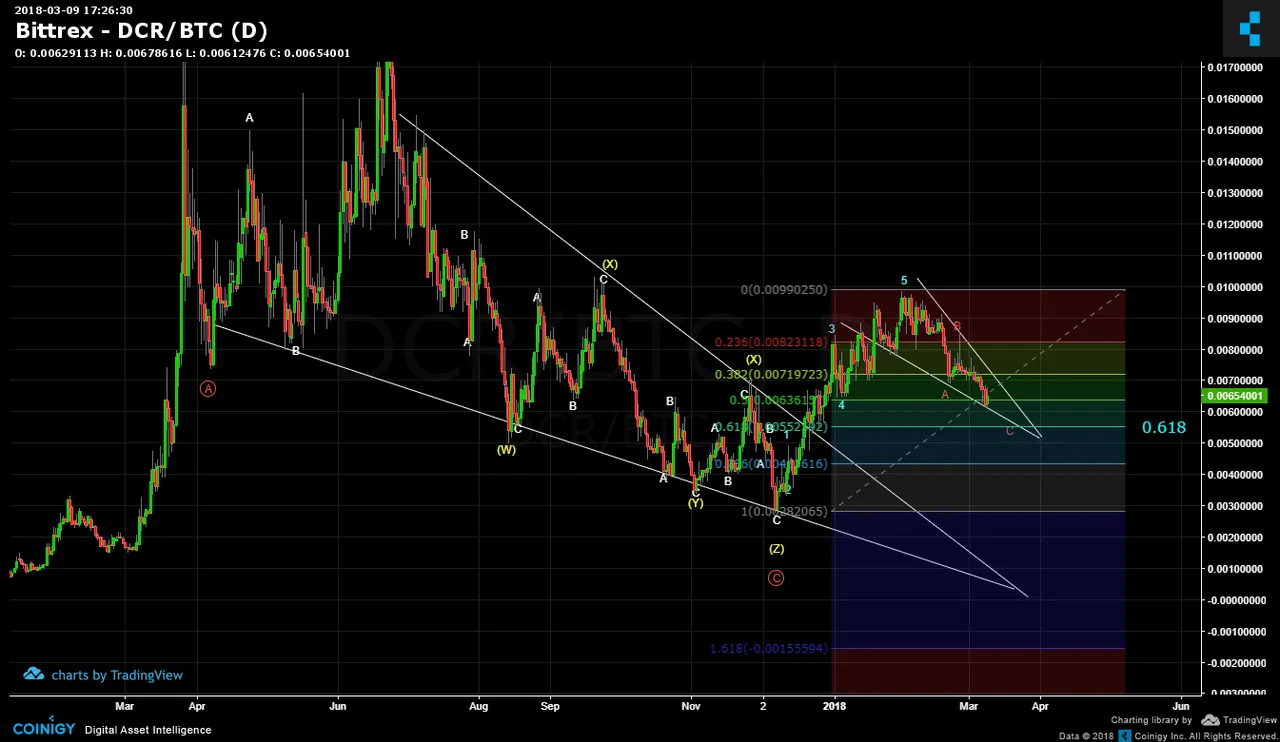
Fibonacci shows that current price is at 50% retrace of the blue impulse motive. I believe the 0.618 is quite feasible as shown in below chart.
Legal Disclaimer: I am not a financial advisor nor is any content in this article presented as financial advice. The information provided in this blog post and any other posts that I make and any accompanying material is for informational purposes only. It should not be considered financial or investment advice of any kind. One should consult with a financial or investment professional to determine what may be best for your individual needs. Plain English: This is only my opinion, make of it what you wish. What does this mean? It means it's not advice nor recommendation to either buy or sell anything! It's only meant for use as informative or entertainment purposes.
Please consider reviewing these Tutorials on:
Elliott Wave Counting Tutorial #1
Elliott Wave Counting Tutorial #2
Elliott Wave Counting Tutorial #3
Laddering and Buy/Sell Setups.
Laddering Example with EOS
Tutorial on the use of Fibonacci & Elliott Waves
@haejin's Trading Nuggets
Essay: Is Technical Analysis a Quantum Event?
Follow me on Twitter for Real Time Alerts!!
Follow me on StockTwits for UpDates!!
--
--

