
SUMMARY
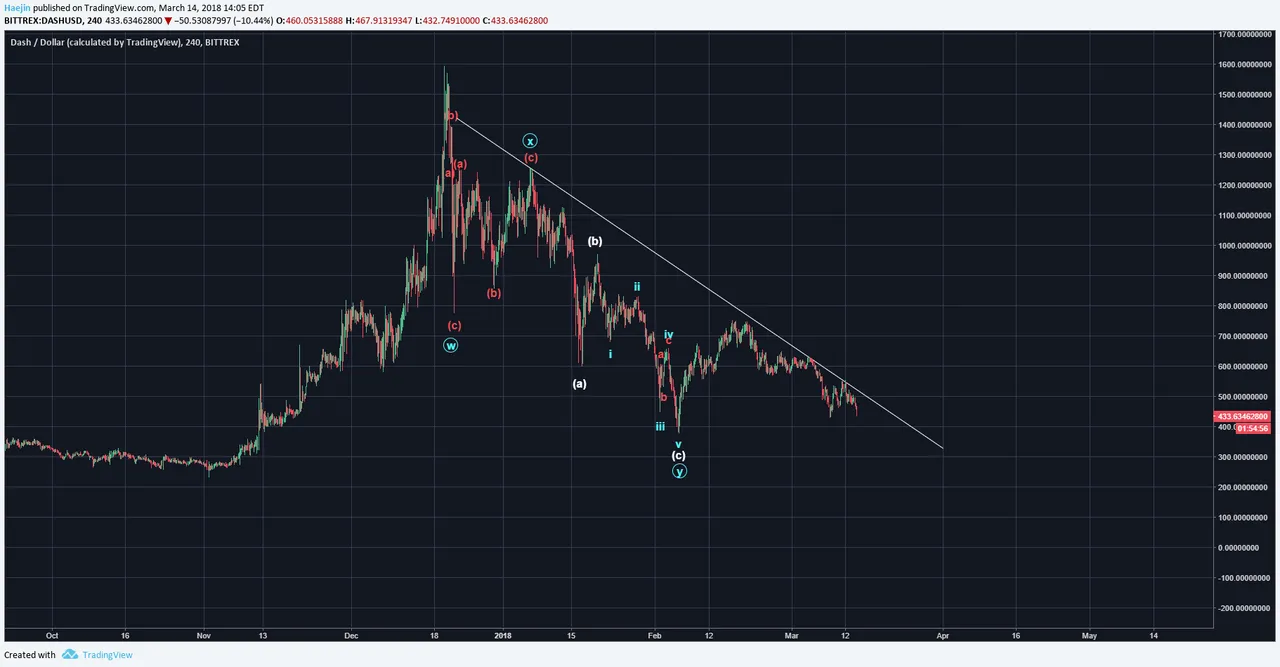
DASH has been consistently repelled by a downward resistance line as shown in below chart. This line needs to be breached in order for the price to start a new trend. The line has been hit now five times and since a resistance weakens with each attempt, it's still unclear as to when the decisive breach will occur. Elliott Waves show that subwave placements have sufficed for a WXY (blue) pattern and given how price has been adhereing closely to the resistance line, the top alternate could still be a on emore lower low.
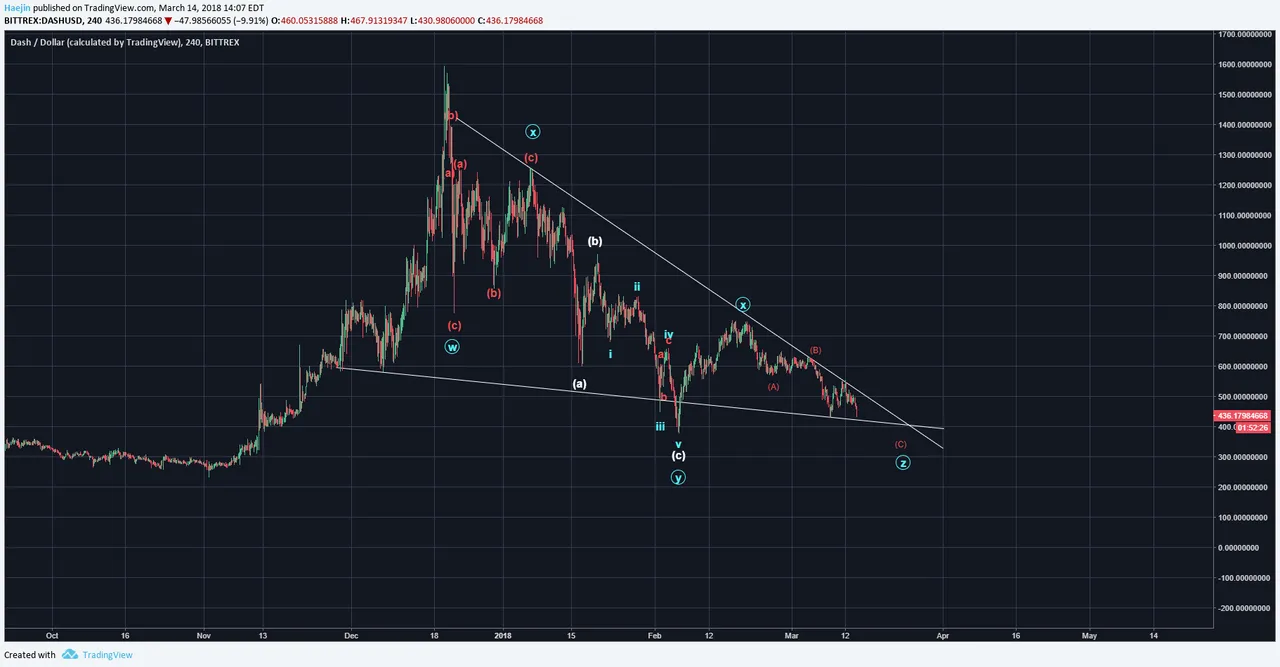
However, if price since the last major peak is encased within the contracting triangle lines, then curren proximity to the Apex is quite close. If the WXY is updated to the WXYXZ triplet, then the pattern is able to absorb for the potential lower low.
A note of caution arises when viewing the daily chart. Note the degree of extension for the 5th wave. I've written plenty about the propensity and danger of 5th wave extensions. The retrace is often towards the zone between the prior waves 2 and 4. That's a range between $76 and $248; hence, well below the 0.78 Fibonacci zone. Often the 0.88 or 0.93 zones are hit with 5th waves that are super extended. Do you think this 5th wave looks super extended?

Legal Disclaimer: I am not a financial advisor nor is any content in this article presented as financial advice. The information provided in this blog post and any other posts that I make and any accompanying material is for informational purposes only. It should not be considered financial or investment advice of any kind. One should consult with a financial or investment professional to determine what may be best for your individual needs. Plain English: This is only my opinion, make of it what you wish. What does this mean? It means it's not advice nor recommendation to either buy or sell anything! It's only meant for use as informative or entertainment purposes.
Please consider reviewing these Tutorials on:
Elliott Wave Counting Tutorial #1
Elliott Wave Counting Tutorial #2
Elliott Wave Counting Tutorial #3
Laddering and Buy/Sell Setups.
Laddering Example with EOS
Tutorial on the use of Fibonacci & Elliott Waves
@haejin's Trading Nuggets
Essay: Is Technical Analysis a Quantum Event?
Follow me on Twitter for Real Time Alerts!!
Follow me on StockTwits for UpDates!!
--
--

