Binance is the most popular crypto trading exchange platform by numbers. The exchange has gained reputation because of;-
i. Its low transaction fees
ii. Simplicity in interface
iii. Its listed with 222 cryptocurrencies therefore giving traders a wide range of choice.
iv. It has a multiple number of indicators that gives the trader a great opportunity to analyze market trends and settle on the appropriate coins to trade in.
Every trader wants to make profit in the shortest span of time, however most times the market conditions dictate otherwise. Some traders are caught in bull traps – when the market trend seems to be going upwards while in reality its going down and the result is a loss. Short and long-term price focus most times does not hit projected targets or may take more time than projected and will eventually delay the projected profits and timelines.
It becomes more complicated when the market becomes bearish – decline in coin prices and increase in volatility.
My experience with Binance is that to make a profit in the shortest time possible, you have to be a ‘snipper’ trader – be aware of the opportune moment, POUNCE, KILL and LEAVE (PKL) before things start going out of hand.
Binance has a total of 16 indicators. Each indicator has its use.
i) MACD – Moving Average Convergence and Divergence
ii) KDJ – Otherwise know as the Radom Index
iii) RSI – Relative Strength Index
iv) DMI – Directional Movement Indicator
v) OBV – On Balance Volume
vi) MTM – Momentum
vii) EMA – Exponential Moving Average
viii) VWAP – Volume Weighted Average Price
ix) TRIX – Trend with Momentum
x) StochRSI – Stochastic Relative Strength Index
xi) EMV – Exponential Moving Volume
xii) WR – Williams %R
xiii) BOLL – Bollinger Bands
xiv) SAR – Parabolic Stop and Reverse
xv) CCI – Commodity Channel Index
xvi) MA – Moving Average
For my sniper trading, I use three indicators namely
i) OBV – On-Balance Volume
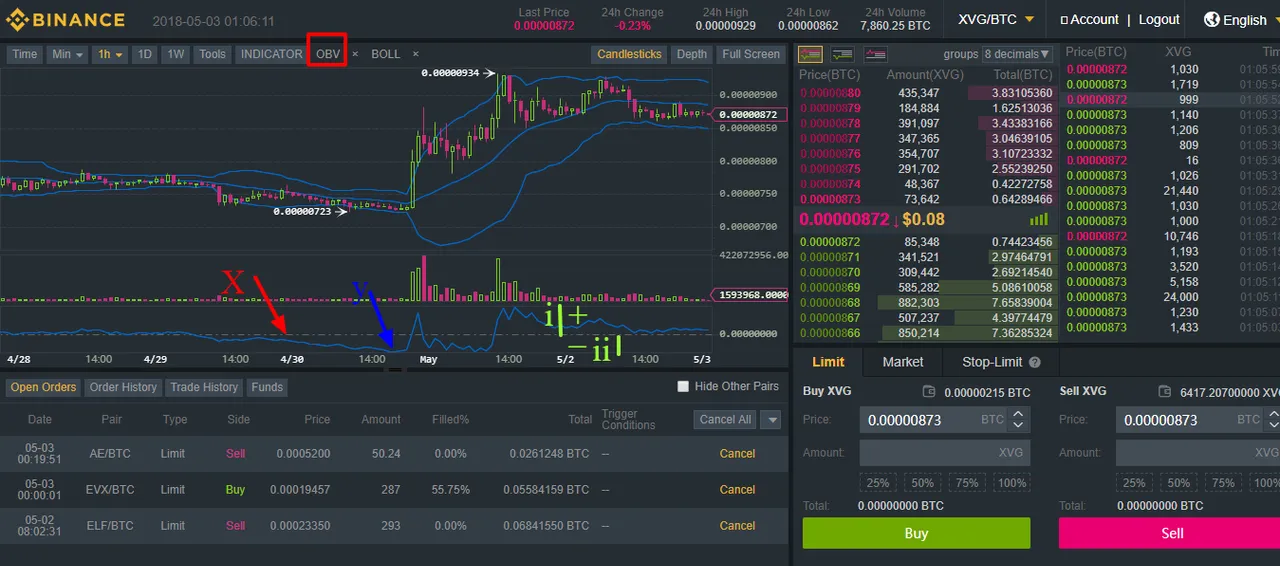
This is a momentum indicator that uses volume flow to predict stock price changes. This indicator is ideal for less sophisticated retail investors. The OBV acts as a confirmation indicator for price trends. If the volume of the coin is a positive high it’s an indication that there is a buying pressure, that means the price of the coin will increase significantly. If the band is on the lower positive, it’s an indication that there is selling pressure and the price of the coin will fall.
The image below shows the following;-
The red box on the with OBV inside it indicates the OBV indicator is selected
Y – The OBV band
X – The neutral line
i - The positive side of the OBV band
ii - The negative side of the OBV band
ii) BOLL – Bollinger Bands
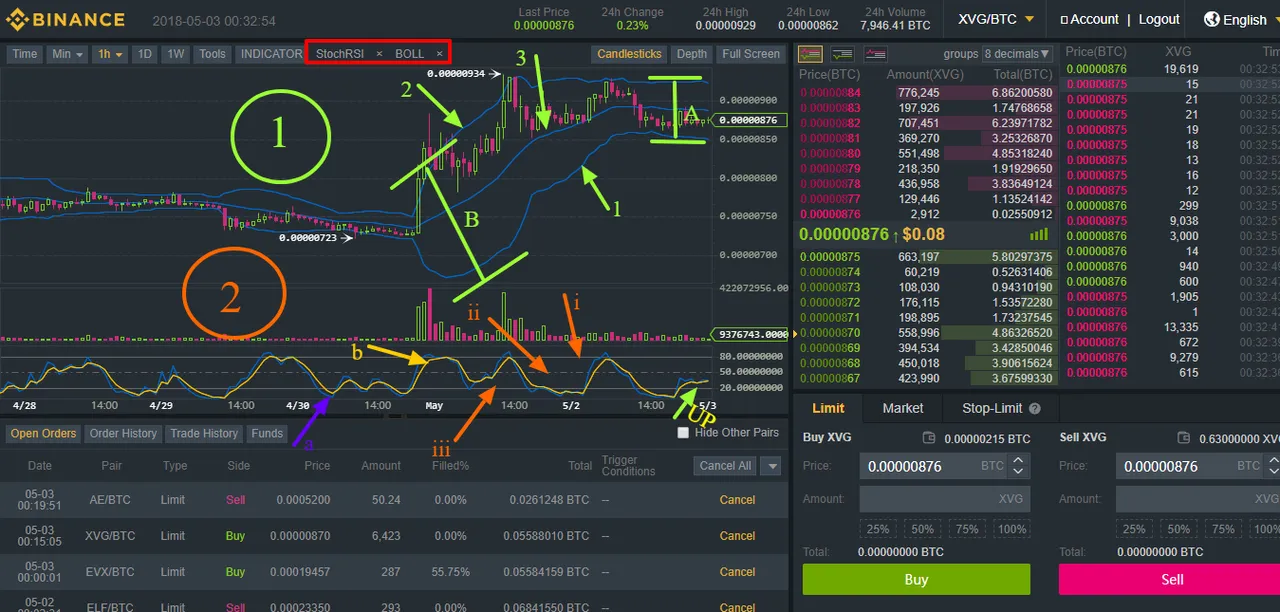
Bollinger bands are two bands that sandwich the market price. The two bands indicate the over buying or selling of a stock. The strategy is to sell when the price touches the upper Bollinger band (2) on the image and buy when the price touches the lower Bollinger band (1) on the image.
The core purpose of Bollinger bands is to measure the volatility of a stock. (Depicted by line A and B on the image). A indicates less volatility meaning that its ideal to buy that stock because prices can fluctuate on a moderate scale towards both the upper and lower bands. B on the other hands indicates a high price volatility meaning prices can swing hugely on either direction. In other words when the bands squeeze towards one another, it’s an indication that the price is less volatile creating a favorable buy time. When they move away from one another, it’s a high volatility indicator meaning its dangerous to buy.
iii) StochRSI – Stochastic Relative Strength Index
The StochRSI indicator is an indicator of an indicator. It’s a stochastic calculation to the RSI indicator. This indicator is a measure of RSI over its own range in a specified time. The range is presented by a middle line with value 50 (i on the image) an upper line of value 80 (ii on the image) and a lower line of value 20 (iii on the image). These three lines are very critical because they indicate the over buying and over selling of a stock.
When stochRSI is above 80 that means the stock is overbought and it’s time to sell because price will go down eventually. When it moves below 20 its over sold and its time to buy because the imminent result is the price moving down.
The best time to buy is when the price start moving slightly past 20 as shown by the (UP) arrow on the image.
The Sniper Strategy
i. Scan through all the coins to establish which ones have the StochRSI rising from band 20. Start with coins which have a high negative increase. There is a high chance that their prices are at level 20 of StochRSI. Coins with a high positive increase are a potential bull trap scenario and should be given less priority.
ii. For each coin establish the 24hr highs and lows and compare with the current price. Prices closest to the 24hr low are the best to buy because it’s a clear indication that the price can rise a phenomenal high bringing a huge profit and a little loss just in case the price dips due to change in market dynamics.
iii. Use the Bollinger bands to establish the volatility of the prices of the coin. If the bands squeeze towards one another, it’s an indication that the price is less volatile. If the bands expand away from one another then the price is very volatile. Trade coins that have the bands squeezing towards one another because that’s indicates the price will not have a high dip just in case the market turns otherwise.
iv. Check the OBV indicator to find out if volume is on the negative side or positive side. If Volume is on the higher side of the positive, it’s an indication that price will go up. If on the lower negative side them price may go down. Buy coins that have volume on the positive side.
v. Watch as the price of the coin goes up and sell at a reasonable increase from the point of purchase so that you make a profit and cater for the exchange sell charge. The recommended maximum sniper price increase time is 2 hours. Buy three a maximum of five coins at each buy so that enough attention is given to each price increase.
vi. With the above I hope you get to the top of daily trading and make huge profits!
#Cryptocurrency #MACD #StochRSI #BollingerBands #VWAP #EMA #OBV