IOTA is acting as expected. It's reaching our targets perfectly.
First, bullish target $2.04
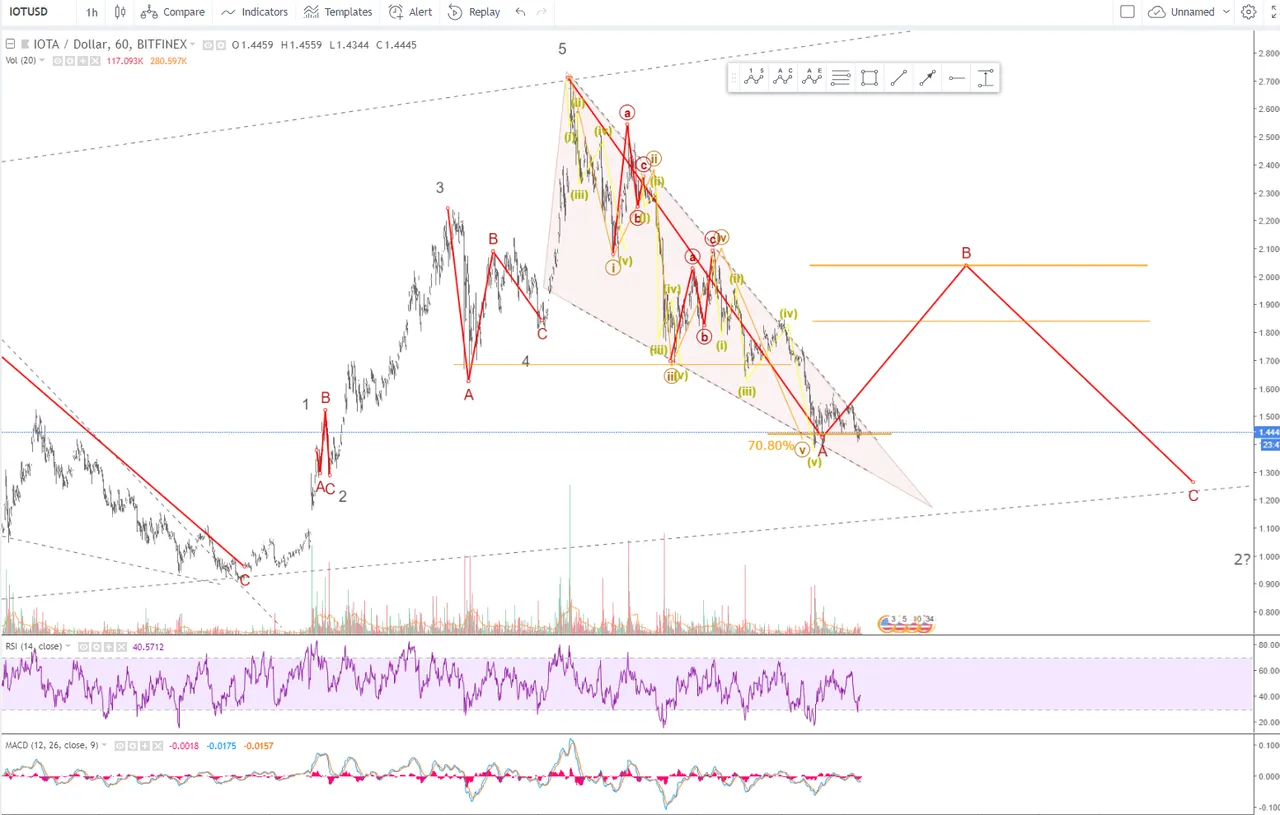
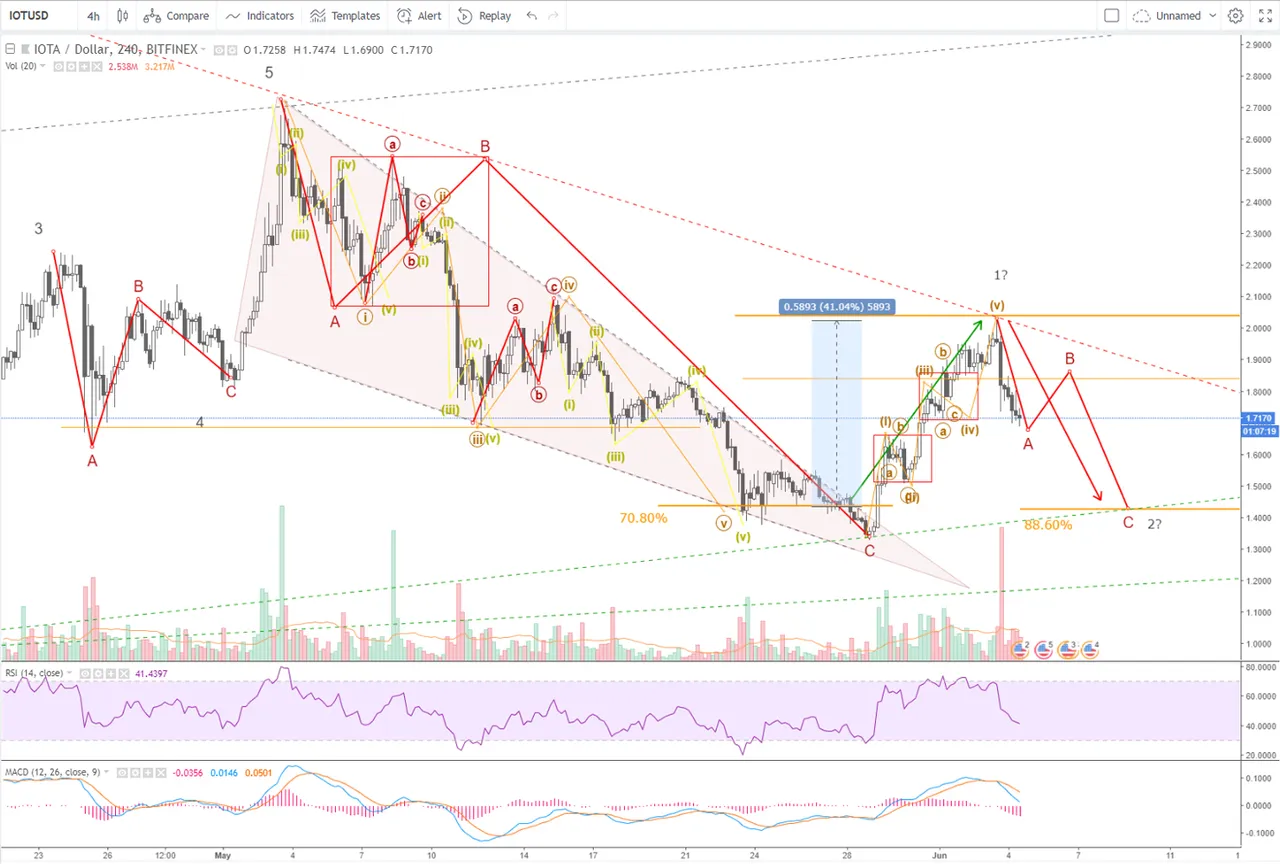
Second, bearish target $1.43 (it stopped at $1.47)
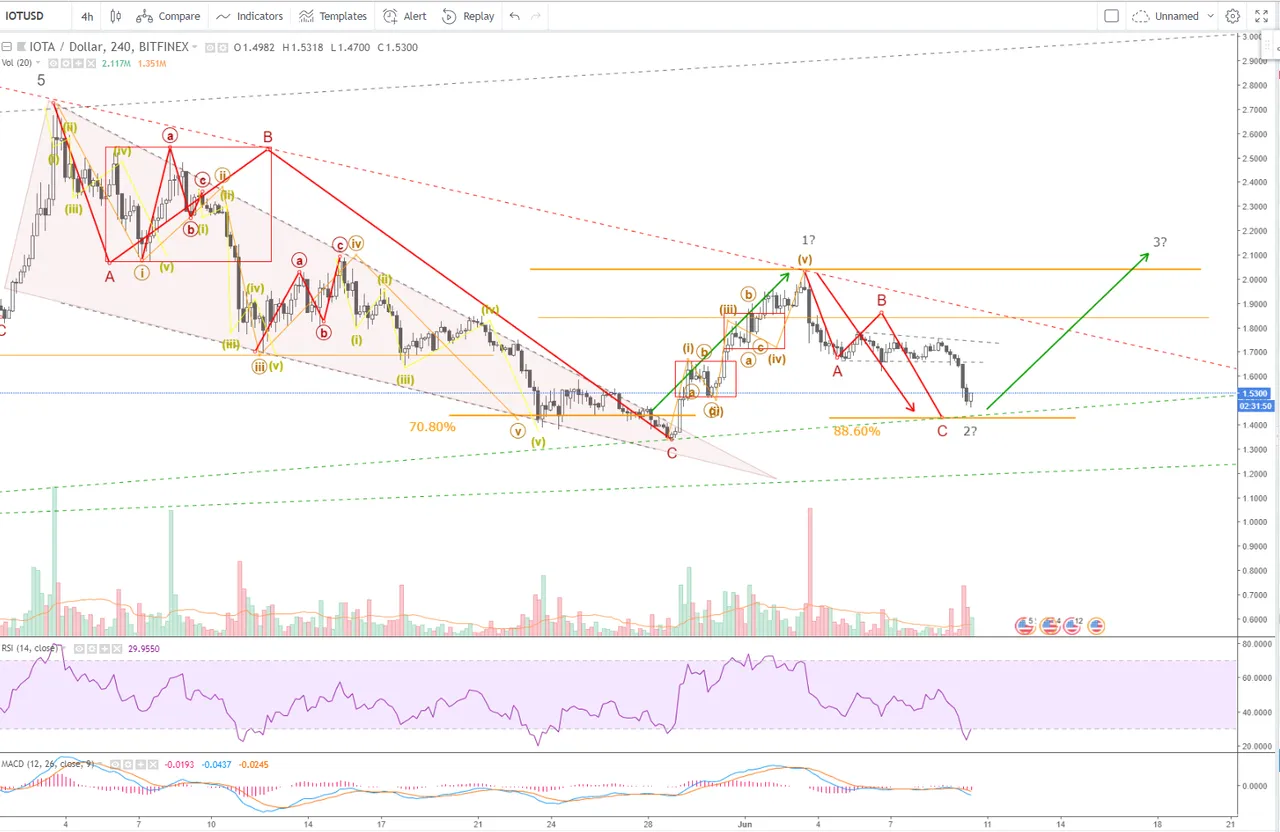
Now it's going up for wave 3 (probably). It cant go lower than $1.34 for that scenario to be valid. As wave 2 cant go lower than begin of wave 1.
IOTA has low RSI on 4h so it can go higher for some time, BUT on 1day chart RSI is far from low, and MACD is also bearish, so it really can check that green support line again (from $1.45 +).
If that line will be broken, then I will update that chart, as this analisys will be no longer valid.
In my analysis I'm using Fibonacci Levels, Elliott Wave principles, Support and Resistance lines, Candle Patterns and formations, like Head and Shoulders or Triangles.
DISCLAIMER
I’m not a certified financial advisor nor a certified financial analyst nor an economist nor an accountant nor a lawyer. The contents posted by me are for informational and entertainment purposes only. Don follow any analysis blindly, and make your own decisions. Always plan your trades and play with stop-loss.
If You like my charts, follow me on Twitter https://twitter.com/Woytech
or on TradingView https://www.tradingview.com/u/Voytech/