Seems like IOTA finished it's 1st cycle and it's ready to start another one.
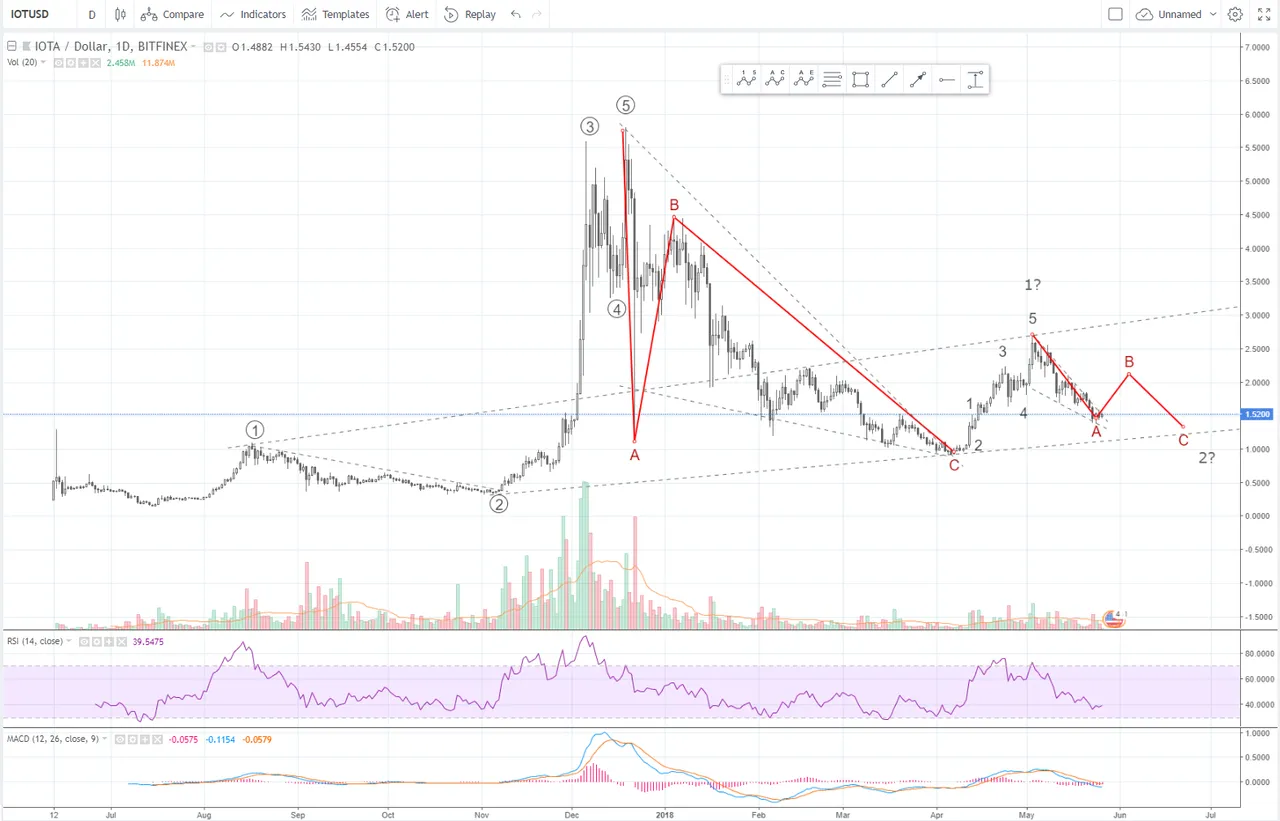
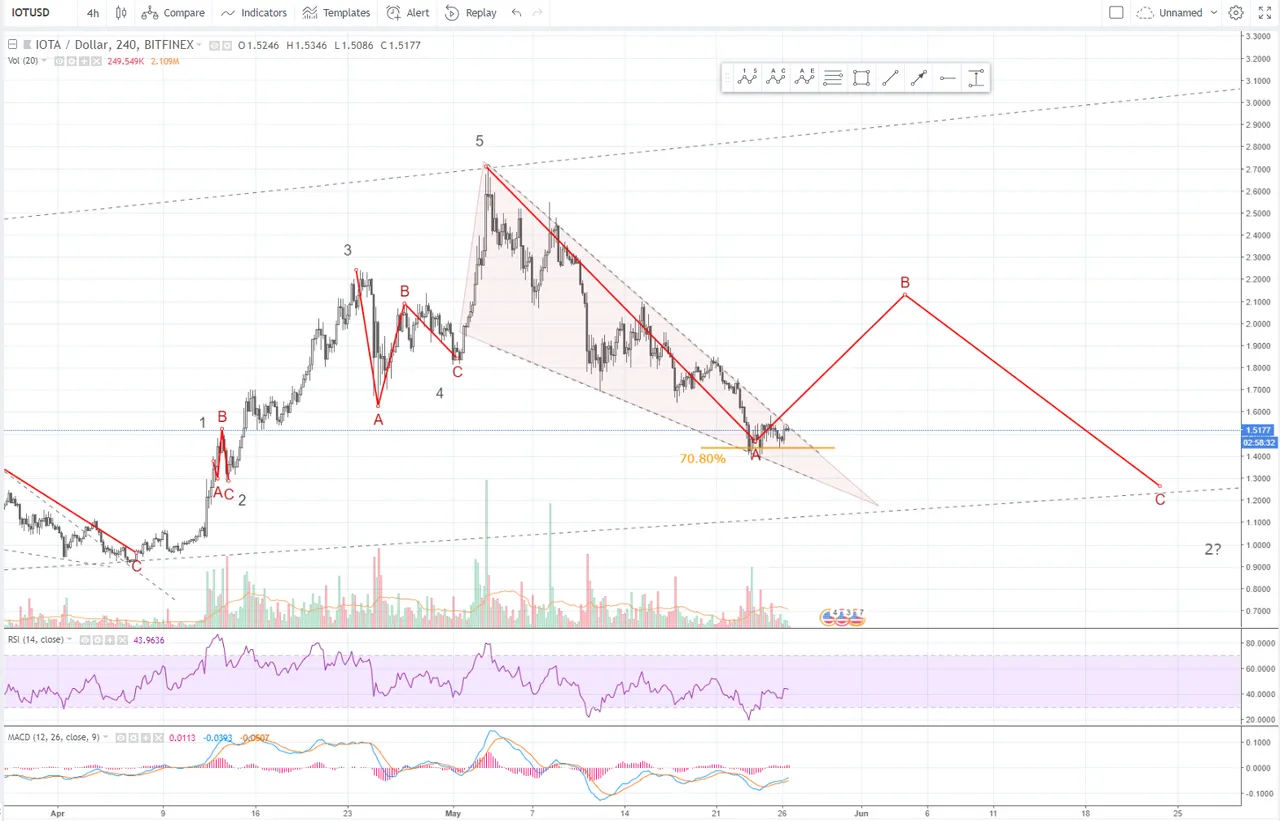
On 4h chart, IOTA is in wave "A" of ABC correction, and it has faced strong support at 70.80 Fibonacci lvl.
Wave "A" might end here as it was in "Falling Wedge" bullish formation, and first will be facing bullish wave "B", then bearish wave "C" which may last till that trendline.
I still need to see a breakout off that "Falling Wedge" for wave "B" confirmation.
In my analysis I'm using Fibonacci Levels, Elliott Wave principles, Support and Resistance lines, Candle Patterns and formations, like Head and Shoulders or Triangles (latter more often than the former).
DISCLAIMER
I’m not a certified financial advisor nor a certified financial analyst nor an economist nor an accountant nor a lawyer. The contents posted by me are for informational and entertainment purposes only. Don follow any analysis blindly, and make your own decisions. Always plan your trades and play with stop-loss.
If You like my charts, follow me on Twitter https://twitter.com/Woytech
or on TradingView https://www.tradingview.com/u/Voytech/