After seeing how to get Steem aggregated data (https://busy.org/@verodato/steem-blockchain-the-forest-and-the-trees) and how to connect to the database (https://busy.org/@verodato/connecting-to-the-steemsql-database-via-r), we’re finally going to make some data analysis and to draw a nice chart. Let’s get all the VESTS that all accounts across Steem have (remember, the code below is supposed to be run on R):
library(data.table)
sqltxt <- paste("SELECT sum(cast(replace((vesting_shares),' VESTS','') AS DECIMAL(20,6))) AS 'vs' FROM Accounts")
total_vs <- data.table(dbGetQuery(conn, sqltxt))
Now let's get all the delegations received:
sqltxt <- paste("SELECT sum(cast(replace((received_vesting_shares),' VESTS','') AS DECIMAL(20,6))) AS 'rvs' FROM Accounts")
total_rvs <- data.table(dbGetQuery(conn, sqltxt))
At this point we can check that 32% all all VESTS (or Steem Power) are delegated:
100*total_rvs/total_vs
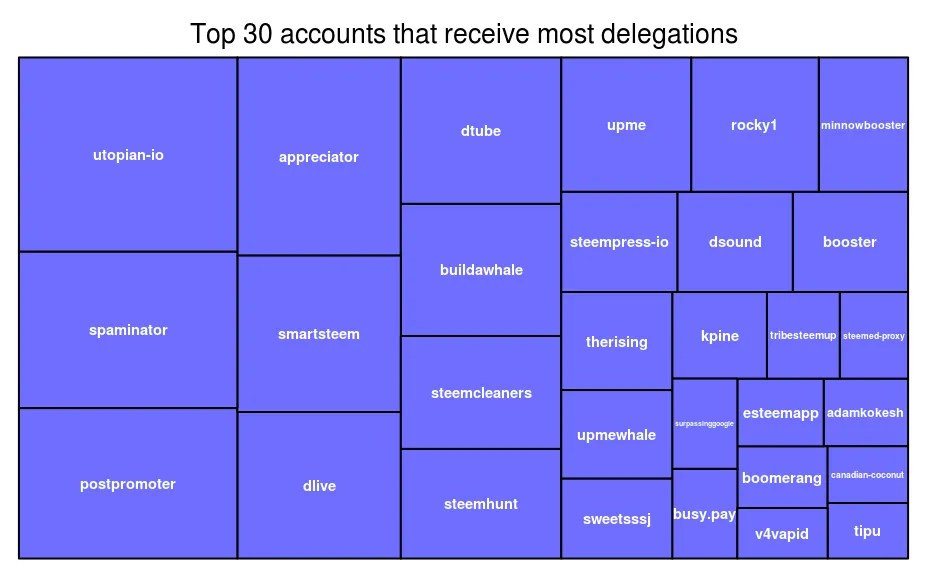
What are the accounts that receive the most delegations? Let's check it out:
sqltxt <- paste("SELECT TOP 30 name, sum(cast(replace((received_vesting_shares),' VESTS','') AS DECIMAL(20,6))) AS 'rvs' FROM Accounts GROUP BY name ORDER BY rvs  DESC",sep="")
top_rvc <- data.table(dbGetQuery(conn, sqltxt))
It turns out that the top 30 accounts that receive the most delegations concentrate 62% of all the received delegations in the Steem blockchain, as you can easily see for yourself by doing:
top_rvc[,sum(rvs)]/total_rvs
Let's present the top 30 accounts in a way that is easy to our readers to interpret the information. We could do it by showing the data in a table, but a treemap is sometimes more informative. It is quite straightforward to build one in R:
df <- data.frame( top_rvc[order(rvs,decreasing = T)] )
library(treemap)
treemap(df,
        index='name',
        vSize = 'rvs',
        palette = "#6E6EFF",
        title="Top 30 accounts that receive most delegations",
        fontsize.title = 20
)
We first had to turn our data structure "data.table" into a "data.frame" and to order the accounts by how much each one had of VESTS. After that we feed the "treemap" function with the delegation data to produce the chart above, in which the size of each rectangle is proportional to how much delegation it has received. In the next post we will keep on diving in the delegation data.