
Project @upvoteinvest on Steemit is designed for everyone who would like to become an investor without actually investing much! All the author rewards for our posts are used as a deposit for trading on crypto stock markets. Thus, generating more profit. All you need to do is to upvote. Every three months we pay back 50% of the income in Steem tokens to our subscribers who contributed to the project by upvoting our posts, according to their contributions.
Hello Steemians,
We guess most of you know that main earnings in trading crypto come from BTC/altcoin transactions. Many traders will probably agree that in this context the market since the beginning of 2018 hasn’t given us a lot of opportunities yet. Everybody's hopes are for BTC settling soon. After this happens, the profits from trading should follow.
As usual, let’s take a look at the BTC chart:
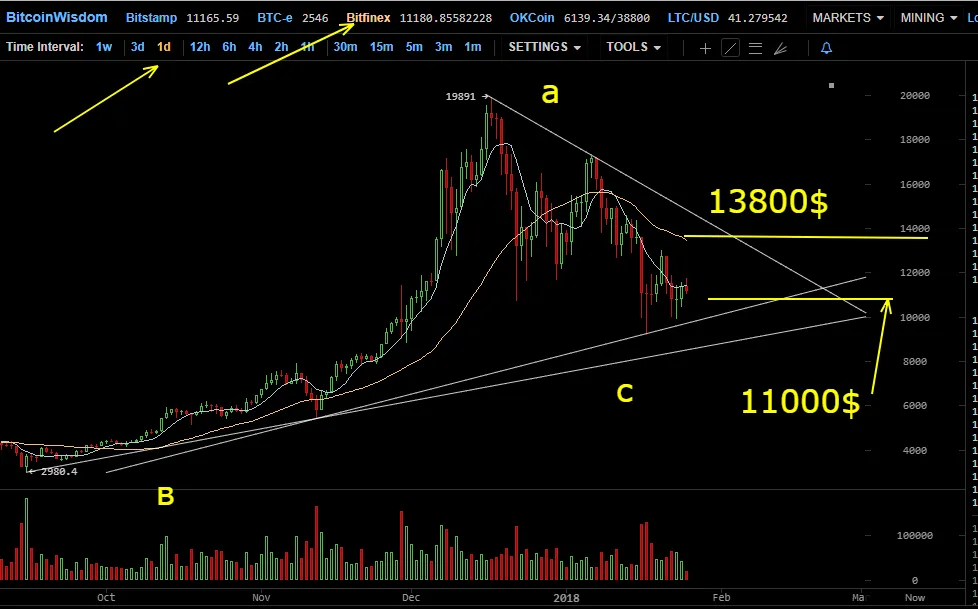
The main thing that drags our attention here is that pricewise BTC continues floating within the triangle formed by resistance line a and support line b. Based on our experience we assume that BTC is very likely to continue its growth today and tomorrow till it reaches somewhat $13800. After that we are expecting the price to drop again to $11000.
This type of BTC leveling out is implied by the ETH chart:
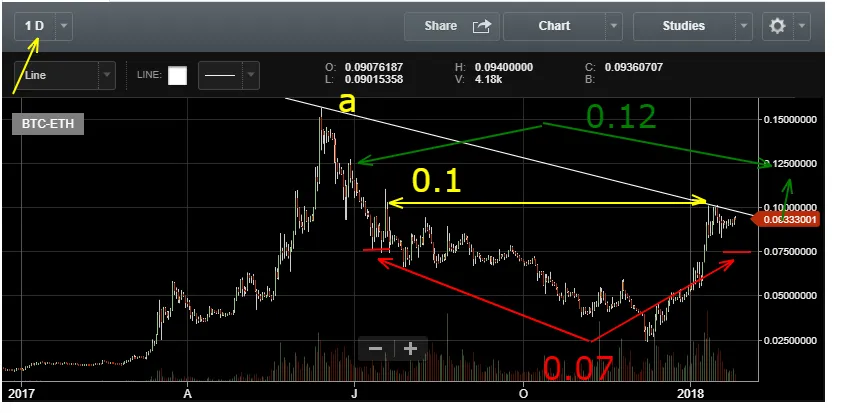
After the price of this coin has reached its maximum of 0,1 BTC, it didn’t drop down to the unticipated 0.07 BTC. It’s certainly longing for the further, more significant growth, which is as of right now limited by the resistance line a. The ascending trend remains, but is not very pronounced yet. It’s awaiting for BTC to settle and allow ETH some room for evolvement, through the resistance line a all the way up approx to 0.12 BTC.
Take a look at QTUM chart, another coin with substantial capitalization.
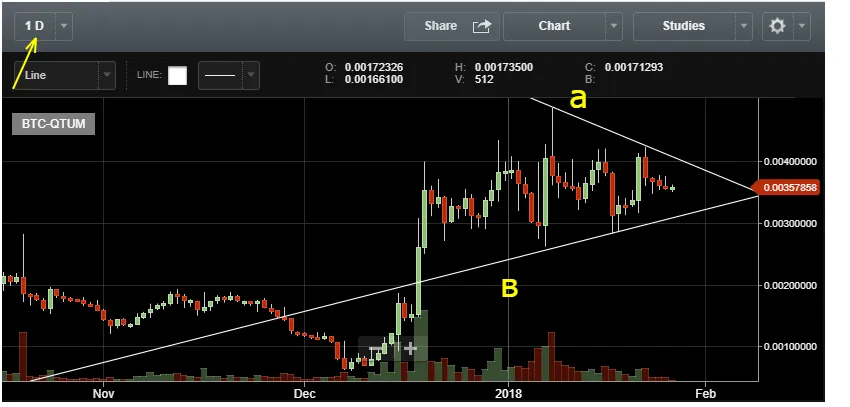
It clearly shows that the price is forming a flag, shaped by lines a and b. From the graphic analysis basics we know that a price movement according to the general trend usually follows in such cases. For this coin it’s obviously ascending. We anticipate that to happen in about a week or so.
With that said, we are coming to a conclusion that BTC will remain within the delineated triangle, the price won’t go higher than $13800 and eventually traders will be switching to altcoins as a more favorable and profitable asset, pushing the prices up. In this scenario Bitcoin perhaps will descend to the supportive line c( the first chart).
It would be surprising to see some coins with even low capitalization pumping up. In fact, this is already happening as we speak. We would like to warn you and suggest that you act very cautiously and thoughtfully since the market situation like this could be potentially risky.
We wish you profitable trading!
The @upvoteinvest team
Those who vote for @upvoteinvest become our partners and investors automatically. If you upvote, you are already entitled to a share of our profit. Remember, the actual amount depends on the frequency of your upvotes, the Steem Power and the percentage you vote with. Don’t miss this unique opportunity to become an investor without investing anything but the power of your upvote!

A formal disclaimer
Some of the posts might contain our opinion on trading strategies based on our technical and fundamental knowledge. However, please, invest at your own risk. We can’t be held responsible for any losses.