
Most people think that investing is complicated or have to see and read lots of books, tutorials, etc. Yes, kind of it is true, but in order to have a constant profit rating you don´t have to be an expert on finance and trading, you only need to know the next:
- Basics of how market works.
- Basic helping tools (indicators), 3 in particular. (which i will talk about in deep in futures posts).
- Consistency and patience (psychotrading, which alsoI will talk about in deep in future posts).
IMPORTANT: You won´t gain 100% of your trades ever, all the tools and knowledge given by others and me at the end are probabilities which used correctly can summon around 80% probabilities of winning every of your trades. With this tips, if use correctly, you could win around 60% - 66.6% of your trades.
REMEMBER: TRADING IS NOT A GAME, IT IS ALL ABOUT THE PROBABILITIES. AMONG MORE LEARNING, THE POSSIBILITIES OF KNOWING WHAT THE MARKET IS GOING TO DO BELOW INCREASE.
LESSON 1. MARKET MOVEMENTS
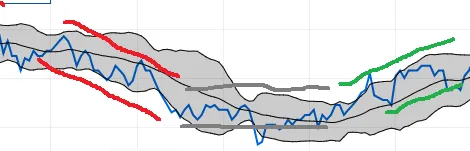
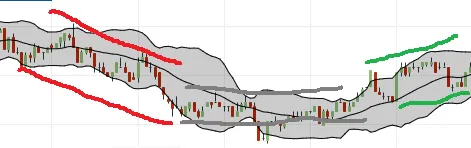
The market has two types of behavior, the first is volatility; or as I like to call it, chopped. The other behavior that all markets are expected to have is a common one, one of cycles. The market has 3 cycles and they go in the following order:
- Low (red)
- Recession (gray)
- Lift (green)
In the following image you can see the aforementioned mentioned:
(Sorry for my shitty editing :+) )
As a starting trader you need to find markets with this type of structure, because is easier to find inputs and outputs, getting a good profit. The way in which you can find the inputs to open a purchase transaction if the market is going up, or sales orders if the market goes down, is thanks to recessions. Next I will teach you to identify breaks, when they are formed, false ropures and in general, how to read graphs.
LESSON 1.1. GRAPHS
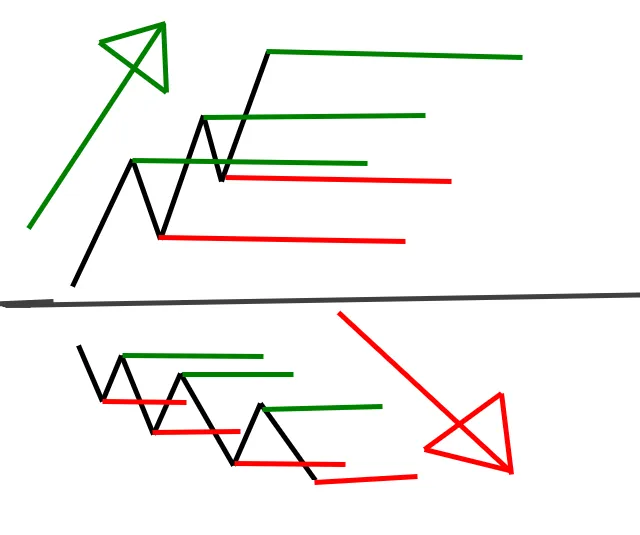
The graphs move in an oscillatory way, for each time it rises it must have a contraction. However, this contraction must be less than the rise. The above should be constant to identify if a market is in an uptrend, or vice versa (that the contraction is greater than the upside, constantly) to be a bearish trend. However, to understand the aforementioned, I do not mention the limits and resistances. The supports are the lowest points at which the contraction arrives, on the other hand, the resistances are the opposite, they are the highest point at which the graph arrives. Being the resistances of green color and the supports of red color.
(shitty editing strikes again :+|)
The supports and resistances do not always tell us the truth, when we enter a state of recession, as I mentioned earlier, there are counterfeits that are false. then I will show some and explain briefly what they consist of.
False ropture 1:
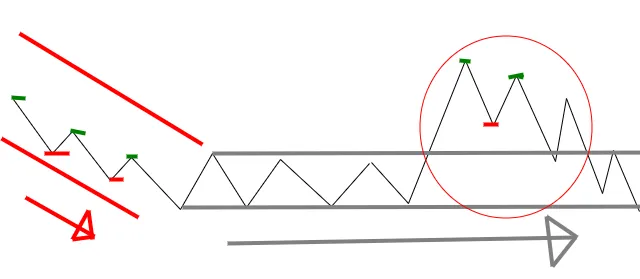
Here in this graph (badly drawn too) we can see how the market goes from a downtrend to a recession, then rise from that range but with a second resistance that does not surpass the previous one. Normally in these cases it is considered a false ropture because it returns to rank, both the general recommendation and mine are the same: wait, keep your position open.
False ropture 2:
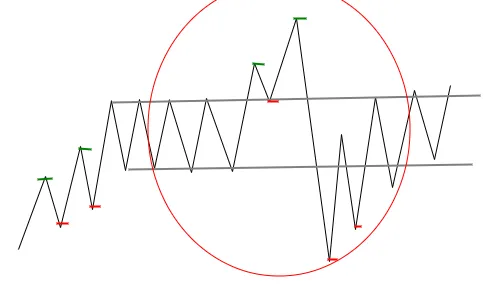
This graph is almost the same as the previous one, goes from an upward trend, then enters a recession. Then rise from that range but with a second resistance that does surpass the previous one. But the contraction following it is equal or bigger than the two resistence.
With the above you have enough to know what to do. With the above I finish the first paragraph of three. Remember that if you liked my content, you can share it, give it a vote and also comment; because your opinion is always important. Greetings and keep an eye on upcoming posts :-)