
Hello, welcome to my new series on indicators with technical analysis. This series will be an ongoing series where I will touch on using different indicators to help with trading the crypto space.
First let me talk about indicators a bit. What is an indicator you may ask and why should I use it when trading?
Investopedia describes indicators as
Any class of metrics whose value is derived from generic price activity in a stock or asset. Technical indicators look to predict the future price levels, or simply the general price direction, of a security by looking at past patterns.
So basically, indicators are used by traders to help them determine when it's best to enter or exit a position. There are several very popular indicators, but today we will be focusing on RSI.
RSI
So what is RSI? Well, I could tell you that it stands for Repetitive Strain Injury, which is what I get after typing out these articles. But, that's not important. RSI, as it stands for investing, is Relative Strength Index. This is an indicator that lets you know if a coin is overbought or oversold.
Why is this important?
Generally, if a coin is overbought, it means that buyer momentum has pushed the price up too high, too quickly, and there will be a correction back down. If a coin is oversold, the opposite is true; the price has been pushed too low by sellers and the price should correct back up by the buyers.
How do you calculate RSI?
RSI is calculated using the formula:
RSI = 100 - 100 / (1 + RS)
Where RS is the average gains during up periods during the specified time period divided by the average loss of down periods during the specified time period. You don't need to know this formula to use it though, you just need to know that it calculates the size of the gains versus the size of the losses. Most traders use a 14-period setting to calculate the RSI. RSI will have a value of between 0 and 100.
How do you use RSI in your trading strategy?
This is the most important part. In the illustration below, you can see that the RSI fluctuates over time. When it rises above 70, it is considered to be overbought. When it dips below 30, it's considered to be oversold.

Indicators are never right 100% of the time, but should be factored into any decision on whether to buy or sell a coin at a specific point in time.
That's all well and good, can you give me an example
If you glossed over most of what I've said so far and just looked at the picture above, well you've pretty much got the idea behind RSI. I'll show you an example below. This chart was created by using Coinigy charting software. (If you sign up for an account with them, I get a small affiliate fee, so thanks for helping out!)
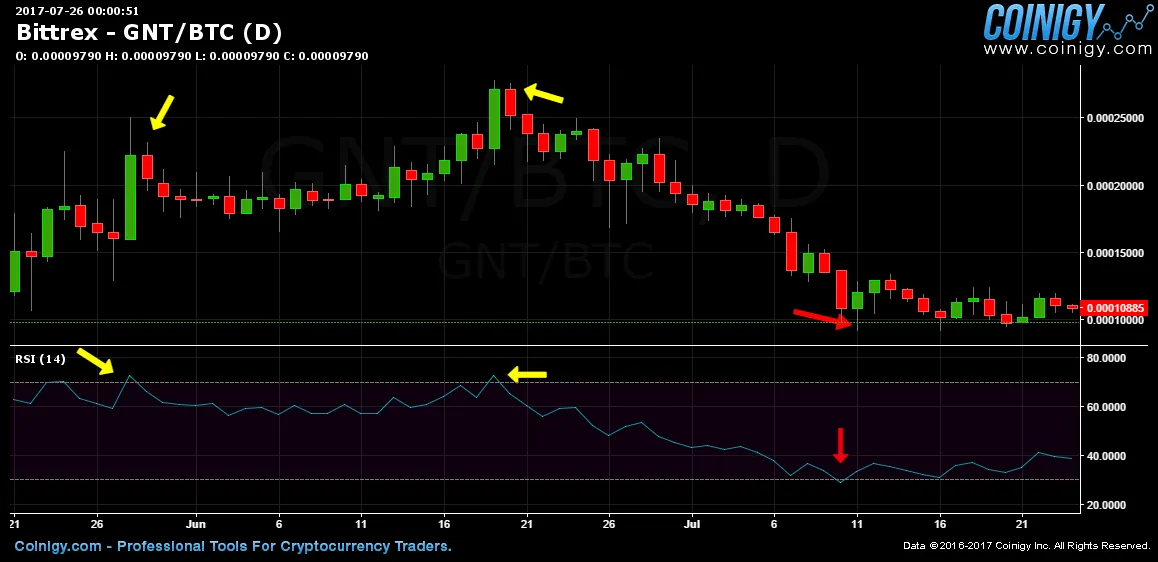
The yellow arrows indicate times in which the coin was overbought. In these cases, you can see that coin then moved on a downward trend directly following.
The red arrow indicates a time when the coin was oversold. Here, you can see the coin move up for a short period.
RSI is used to determine entry points, not long term trends. In this case, the red arrow showed a good entry point for a short term trade, but the longer term trend was still downwards.
RSI is one of my favorite indicators to use, as it really helps you determine an optimal entry or exit point for your trade. It works on all time frames, which makes it quite versatile.
Happy trading!
Like what you are reading? Please consider giving me an upvote and a resteem. Also note that I’m not a financial advisor and nothing you read from me should be considered investment advice. Please do your own due diligence and research. Thanks for reading!