Hi Steemians, Facebooker's and Twitterer's, I have decided that I'm going to post one article every second day on Technical Analysis as we can all benefit from it I'm sure, so here it goes.
The flag pattern should form in what looks like a rectangle boxed in. The rectangle forms by two parallel trend lines that act as support and resistance for the price until the price breaks out of the rectangle, that will trigger a buy or sell opportunity.
In a normal organic formation, a flag will not be perfectly flat but has its trend lines slightly sloping in one direction depending if it is a bullish or bearish trend at that point in time.
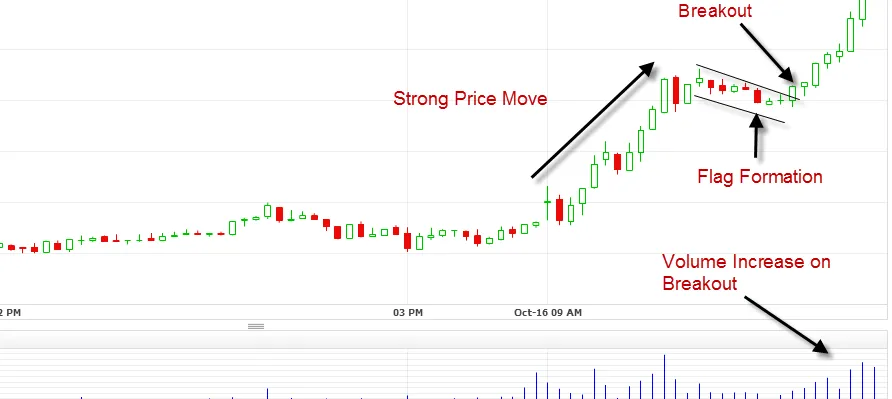
Once again in a organic marketplace the direction of the flag should determine the direction of the breakout, in other words, if the slope is in a down trend, once it breaks out of the last resistance it will be a bullish buying opportunity, obviously if it were the other way around, then it would be a bearish shorting opportunity, or you may also want to sell your shares and re enter as you know there should be a better price coming.
A flag is usually more powerful in ROI terms when you mix it with volume, if volume is increasing, someone was bagging it up, someone who knew of news before it was released to public, if the volume is down trending and you see a bearish flag formation, then someone was offloading their bag hold.
I have used some info from online sources to simplify this as much as I can.
Rev Nissan