An Exponential Moving Average is an indicator that gives you the average value of the asset you're analysing in the last few days, giving more importance to recent data over older one.
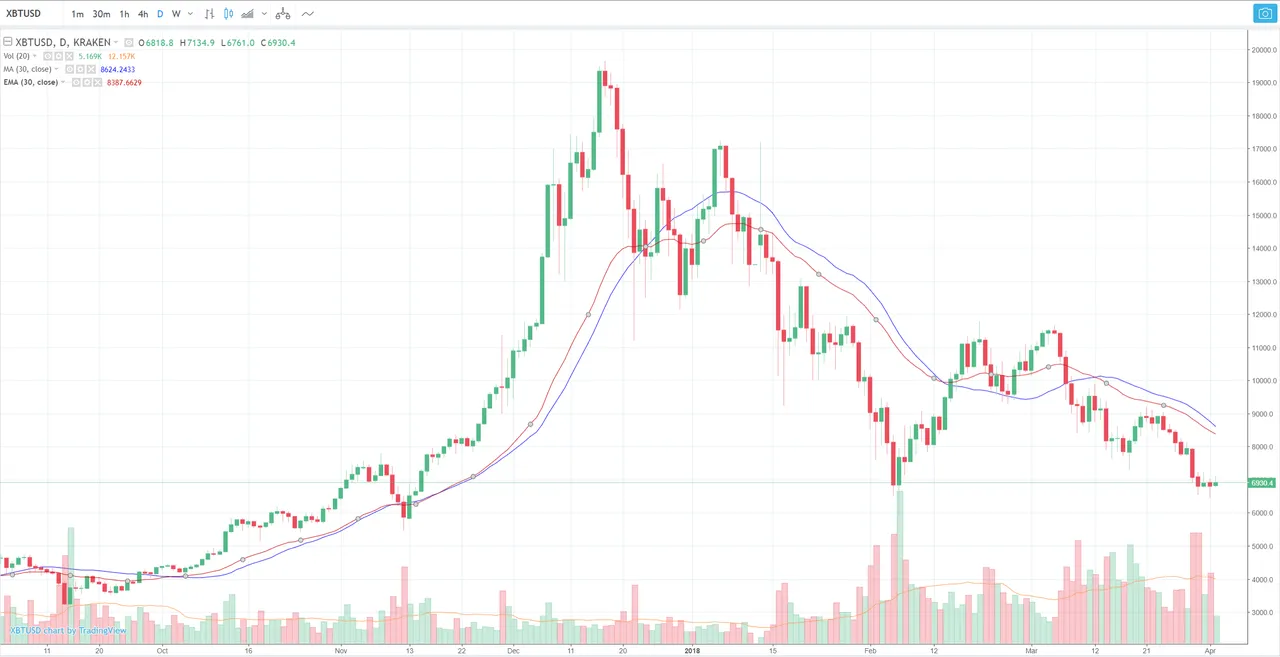
Here's a comparison between a 30 day Simple Moving Average (blue) and a 30 day Exponential Moving Average (red)
- It's used to eliminate noise in price movements and see more clearly in which direction the price is moving
- It's slope indicates how strong the current trend is: the more inclined the line is, the stronger the trend underneath
- The number of days you should use as an input depends on the trend you're trying to catch, a short-term trend requires less days to spot, a longer-term one requires more
If this was any help to you, please consider upvoting and following me for more quality content!