A Moving Average (MA) is a indicator that is calculated just as a simple average.
For example, a 50 day MA is the sum of the last 50 days' closing prices divided by 50
This indicator is commonly used to spot where main resistence and support levels are.
Take a look at this BTC-USD chart:
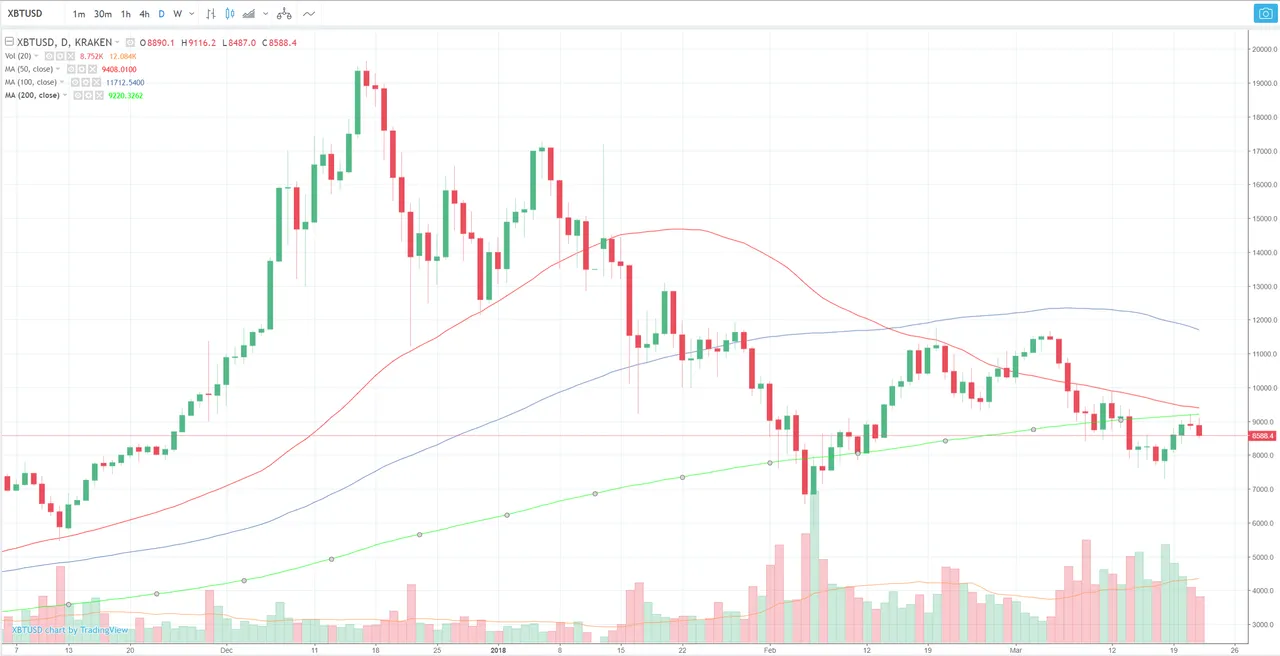
You can see: a 50-day MA (red); a 100-day MA (blue) and a 200-day MA (green)
Yestarday, we hit the 200d MA (which is acting as a resistence) and the prices stoped climbing and went back down.
But, whenever one of this levels is indeed broke, the prices ussualy fall until the next support.
Also, the longer the MA, the harder it is to break
I hope this helps you just as much as it helped me when I learned about it!
Remember to upvote and resteem if you think this was useful for you!
Other posts you may find useful: