The history of Bitcoin price was a rough ride since day 1.
If you study the history of the cryptocurrency bitcoin you realize that bitcoin has been a really rough ride since it was launched around 2009. If you haven't studied the history of bitcoin you should read the book Digital Gold by Nathaniel Popper which covers events up to 2014, so you have to google the rest. If you google you will see that bitcoin reached a price of around $20000 in December 2017 and has been falling since. You keep seeing comments that bitcoin is a bubble and this is a crash.
But remember that listening to comments by random people on the Internet is not always a good idea. A better idea is to use data and study what has happened before.
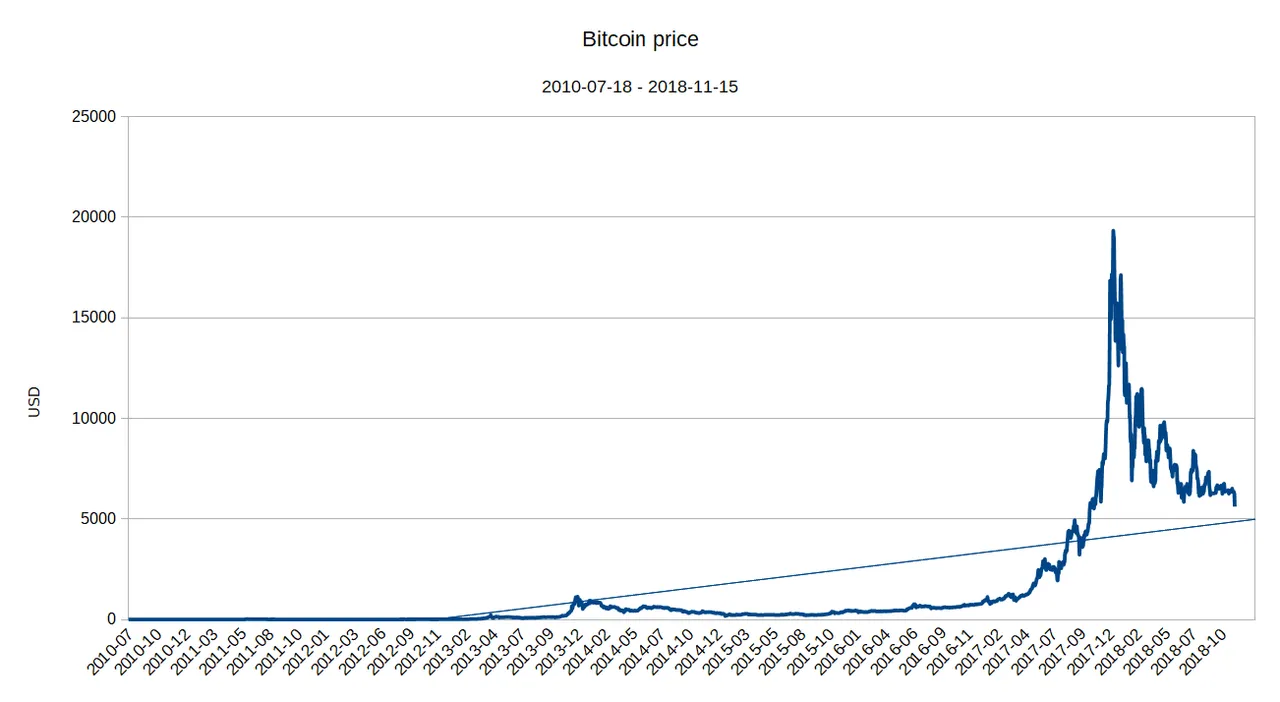
Price
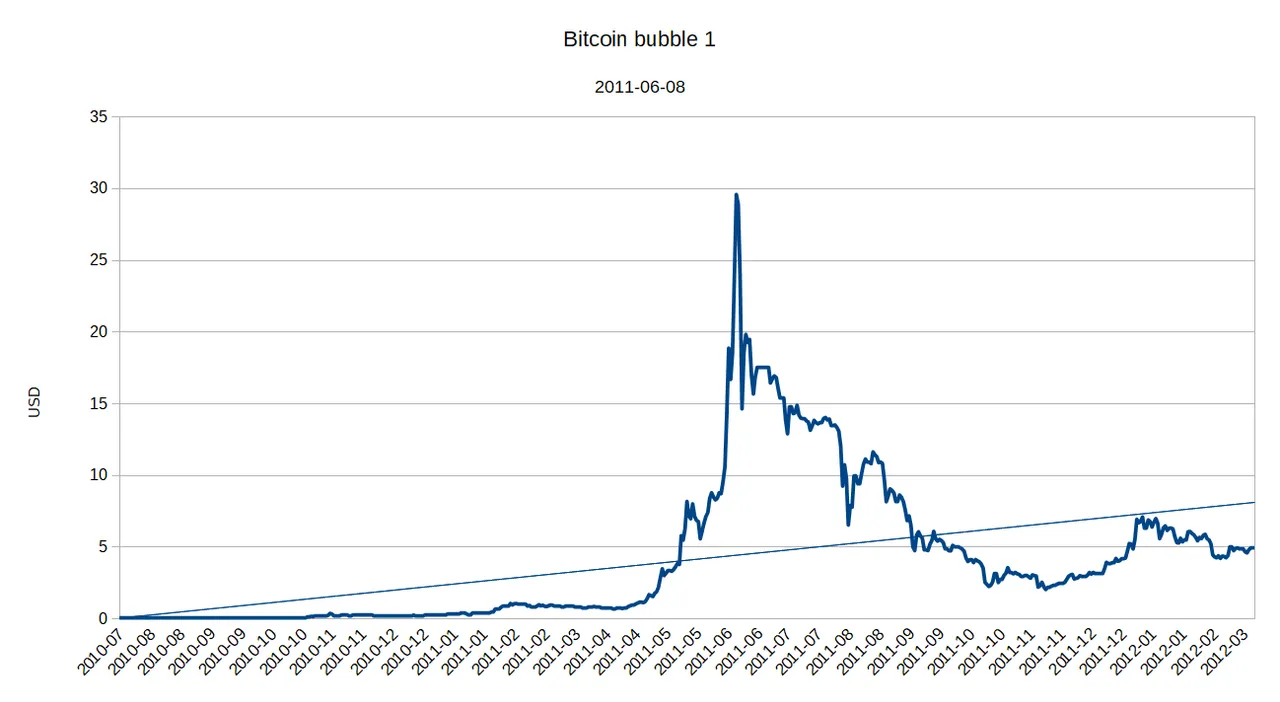
The data I found is from Coindesk and ranges from 2010 up to today. It consists of one price during the day and not necessarily the highest or lowest price during the day, but that's not a big deal if you look at the price in a wider perspective. If you look at all the data you can clearly see that it looks like the classic bubble chart.
To better see what has happened from an historical point-of-view, one way is to change the price axis to a logarithmic scale. You can now better see the tops and bottoms:
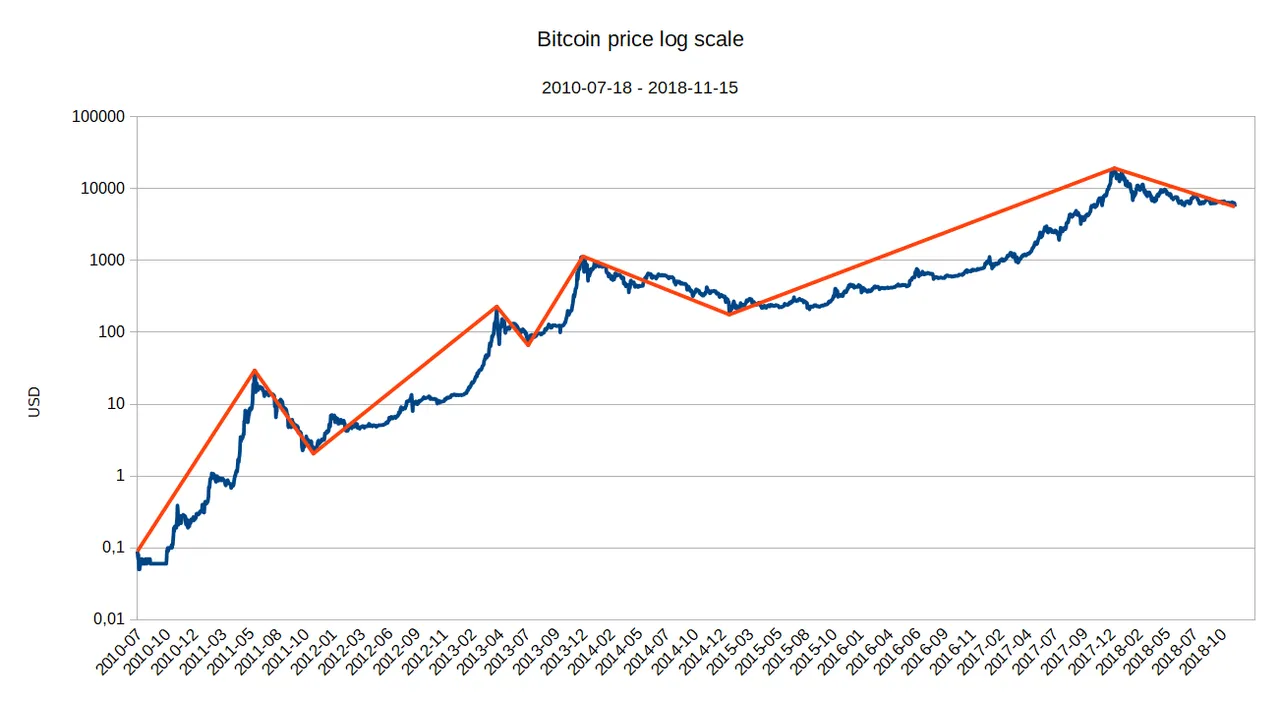
It's difficult to know where a bottom and a top is. But I've defined a top as the highest price before a fall with more than 50 percent to a bottom. A bottom is the lowest price before a raise to a top which is higher than the top before the fall.
Bubbles and crashes
So bitcoin has crashed three times and the fall that began in 2017 is also a crash.
2011-06-08: -93 percent
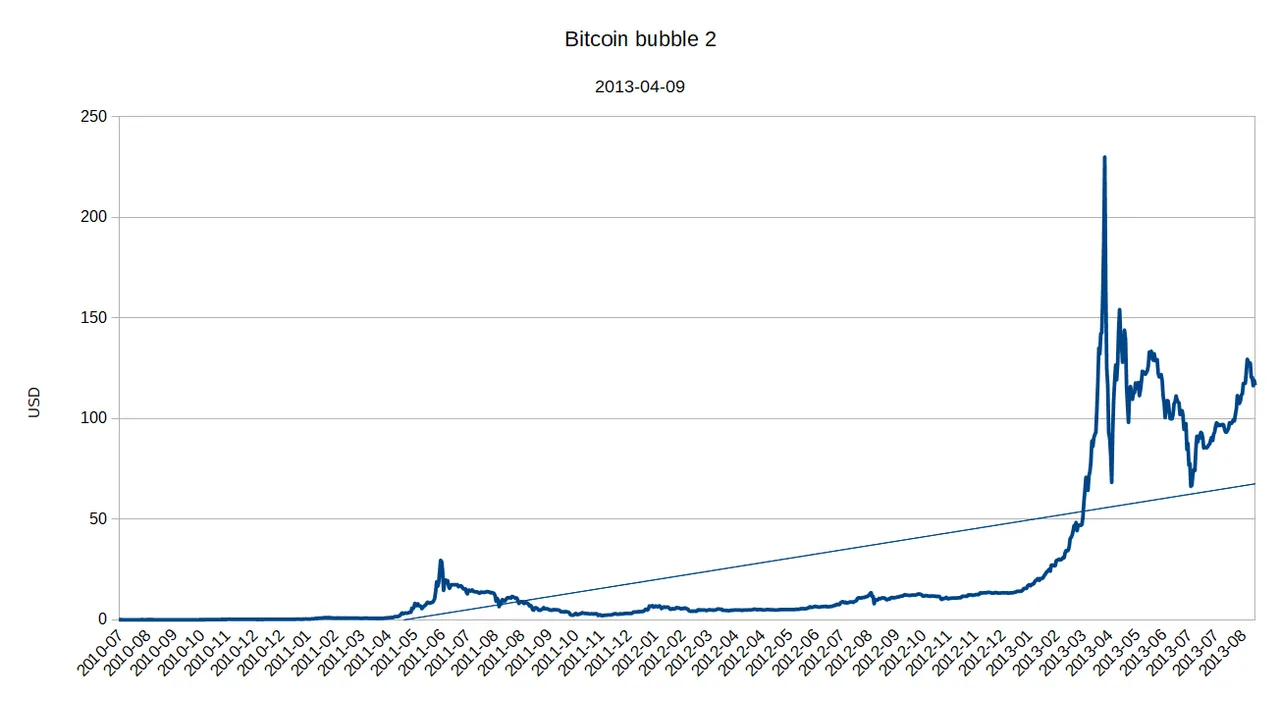
2013-04-09: -71 percent
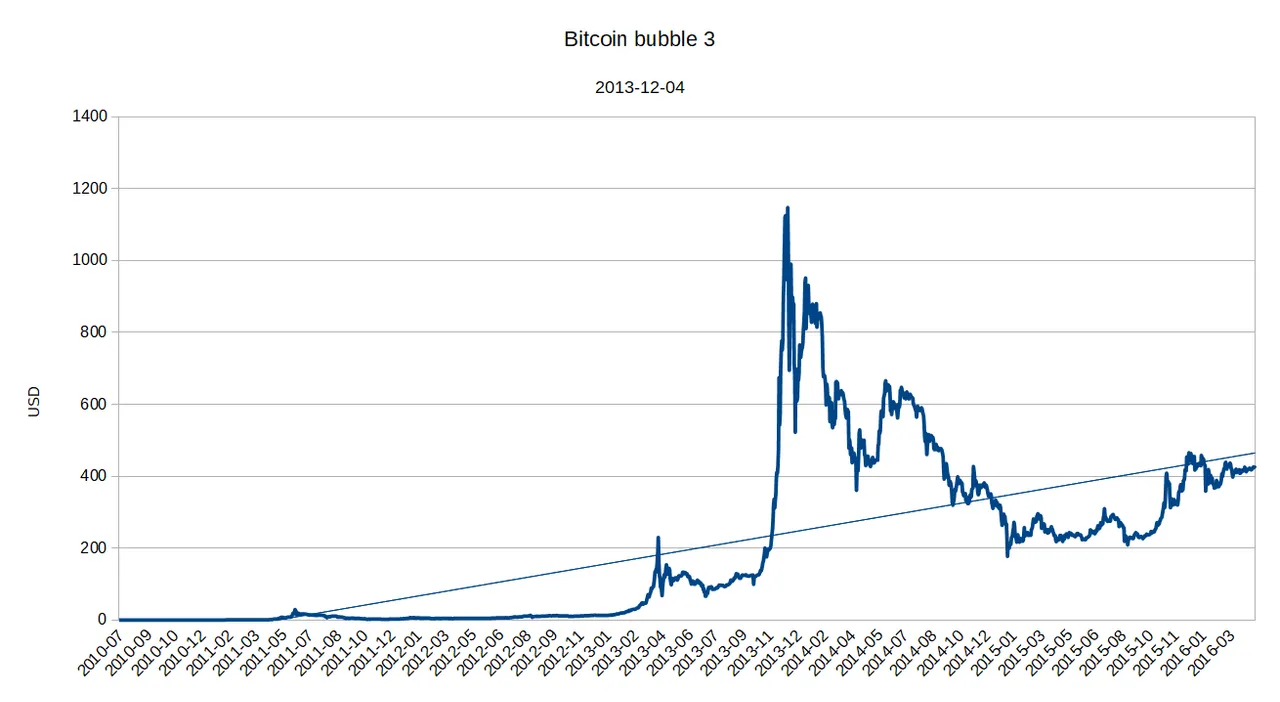
2013-12-04: -85 percent
2017-12-16: -71 percent (2018-11-15)
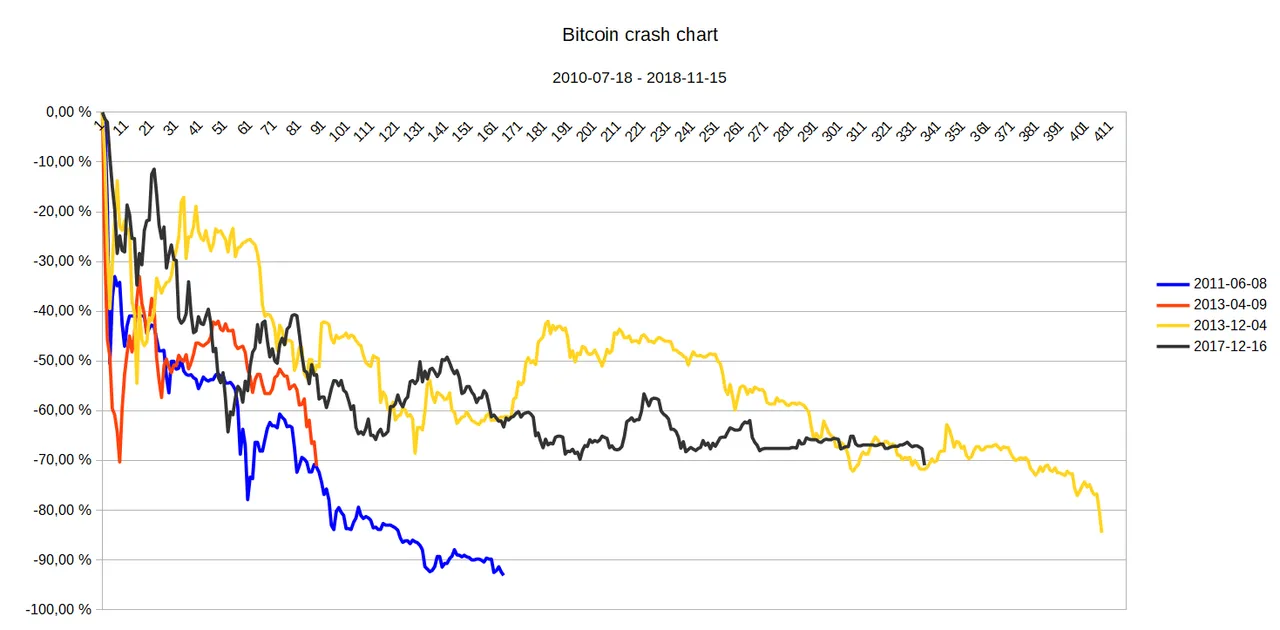
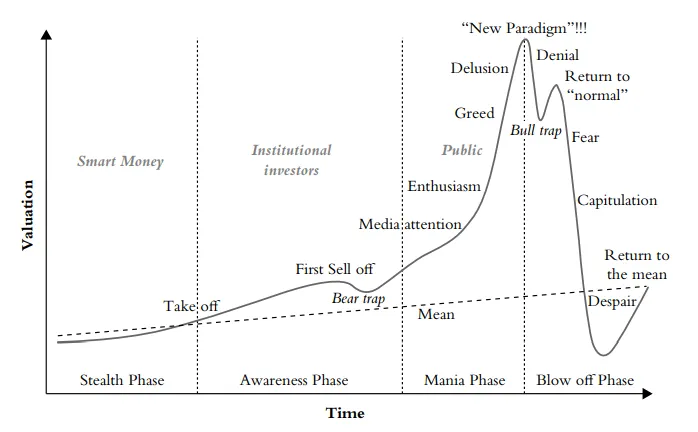
Now we can see how well the "classic bubble chart" fits the previous three crashes:
You can see that the price crashed below the mean line except in one case where the price bounced on the mean line.
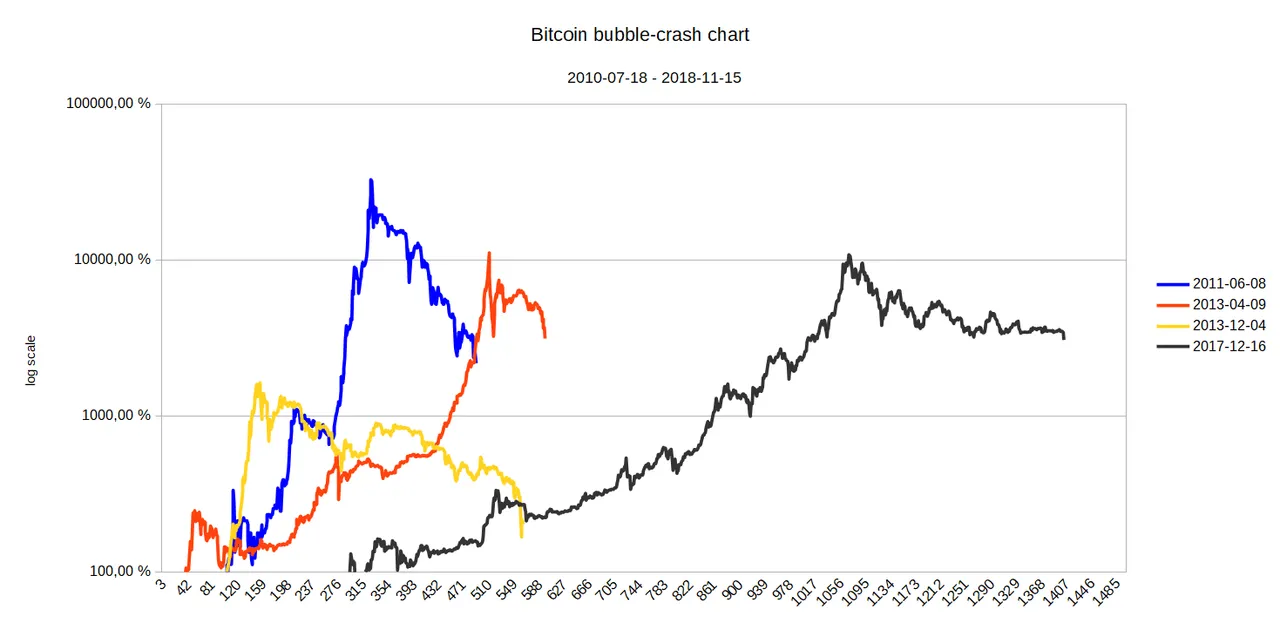
It can also be interesting to compare the bubbles before the crash. I've also included the crashes in this chart, so if you bought bitcoin at the first day of trading in 2010 and sold at the bottom after the first crash, you would still have made 2178 percent. But if you managed to buy exactly at the bottom and sold at the top, you would have made:
2011-06-08: 32789 percent
2013-04-09: 11120 percent
2013-12-04: 1629 percent
2017-12-16: 10811 percent
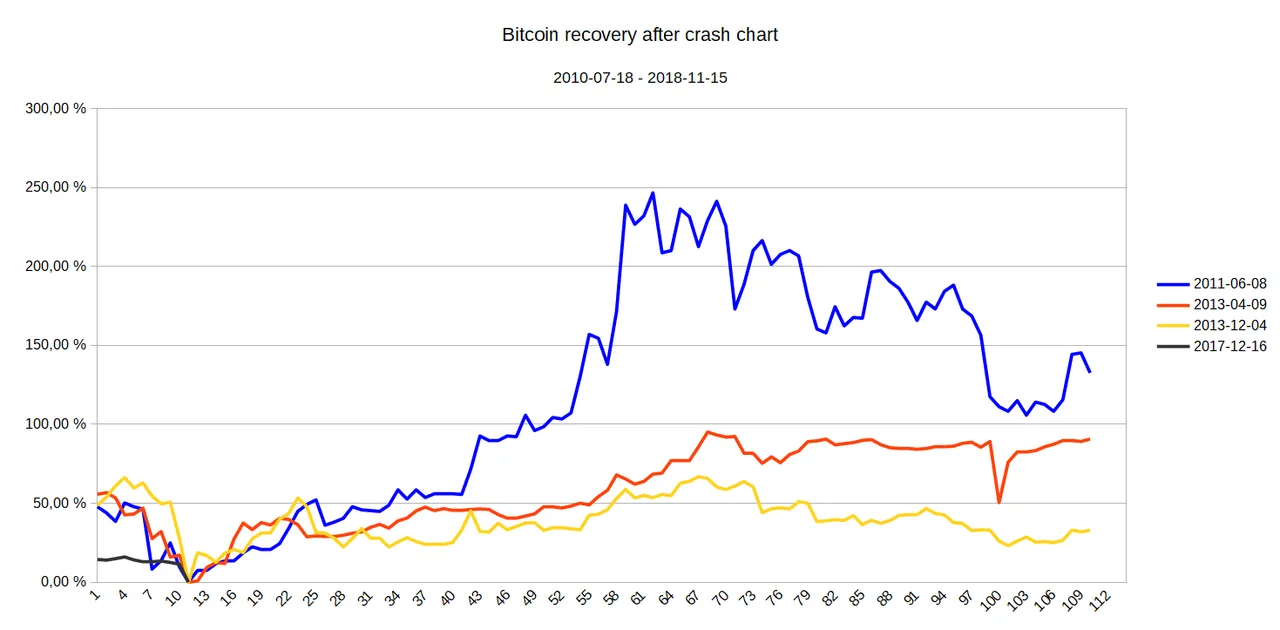
Recovery
After a crash there's a recovery back to normal from the bottom after the crash. This is a comparison between them (the first 100 days after the bottom and 10 days before the bottom).
2011-06-08 bottom: 2011-11-18
2013-04-09 bottom: 2013-07-05
2013-12-04 bottom: 2015-01-14
2017-12-16 bottom: 2018-11-15 (we don't yet know if this is the bottom but it might have been)