After a deep consolidation that has developed during the June timeframe, Stratis may finally have hit bottom. It has hit a key support level multiple times during this consolidation but has continued to find resistance along the descending trend line . That declining trend line is now meeting the horizontal support which also happens to coincide with a key Fibonacci retracement level. Below is the daily chart of STRAT/BTC.
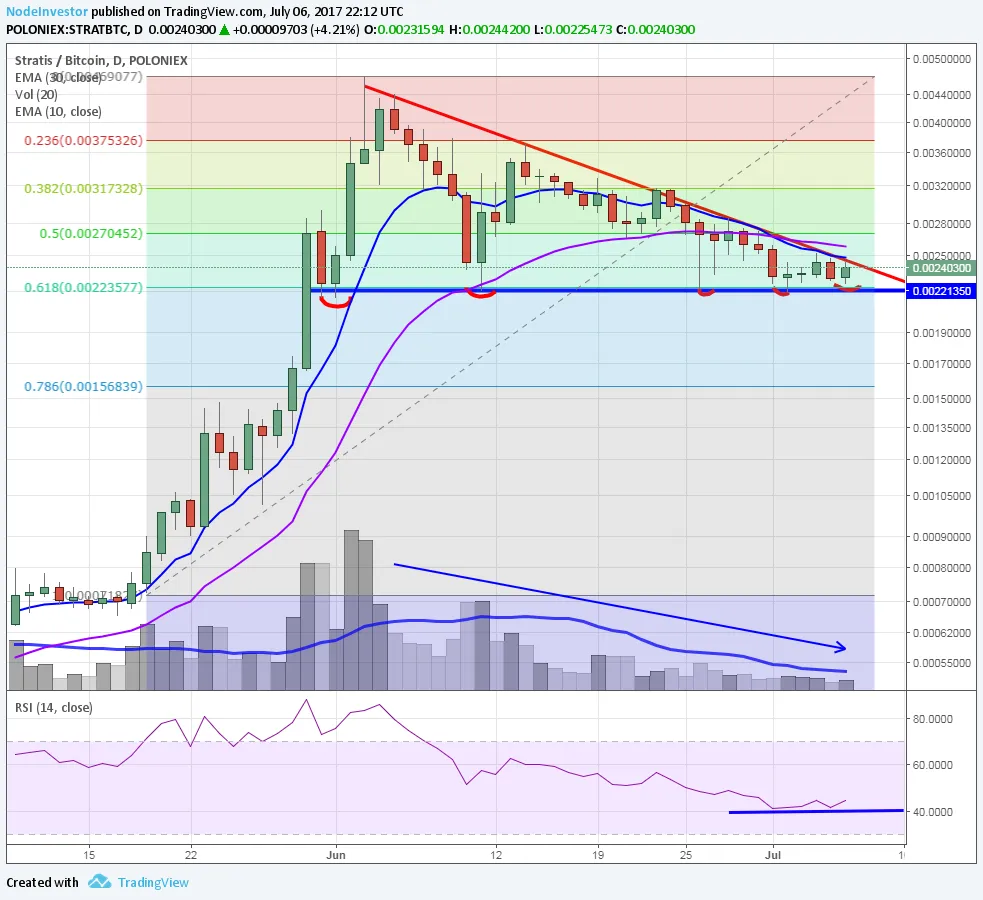
Volume has been drying up during this correction which is a bullish sign that the selling may be nearing its completion. I believe this is the low for Startis and it's getting ready to move higher. Look for a bit volume pop above the declining trend line and shorter term moving averages.
I've posted a video recently covering Stratis along with a few others that may begin moving higher here. Those include Antshares, NEM, & Ripple.