Hello world! Welcome to report where I'm using machine learning to analyze tweets about specified topic and present results in form of various and easy to understand charts. The sentiment analysis algorithm has been developed as part of my Master Thesis in 2017/2018.
This report is currently being published exclusively here on Steemit.

Parameters
Today's analysis has been executed on tweets which contain word "blockchain" and were published between 2013-01-01 and 2018-12-31. Detailed specification of the data is shown in the following list:- Keyword: blockchain
- From: 2013-01-01
- To: 2018-12-31
- Number of analyzed tweets: 50000
- Tweets per week: 159
- Language: en
- Geographical location: Not specified

Results
Sentiment
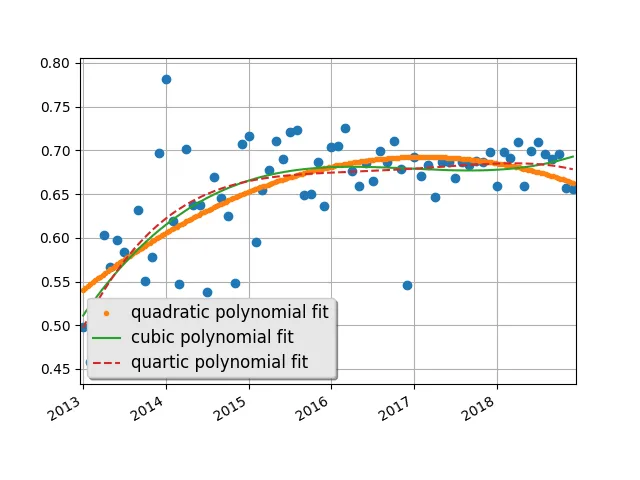
After downloading 50000 tweets between the specified dates, sentiment analysis has been executed on each and every one of those tweets. Sentiment score has been then aggregated over weeks and months, to lower the granularity of results on the time axis and then plotted as a following linechart.My subjective comment on the chart: Thousand wows! :) We can totally see how nice the trend was in the previous years...altho during the 2017 when the biggest boom was happening, tweets popularity was not rising anymore. Could we predict the bear is coming?
Aggregation using heatmaps
To show the general trend/pattern in the sentiment, linechart works great. We can see the bigger timeframe and estimate the long-term direction. But if you're interested in particular month or week, it's hard and in case of weeks actually impossible to see the change. Has an athlete put the great performance in particular match? Has the brand/company released a new line of product? So see such low lever changes, following 2 heatmaps are to be used.
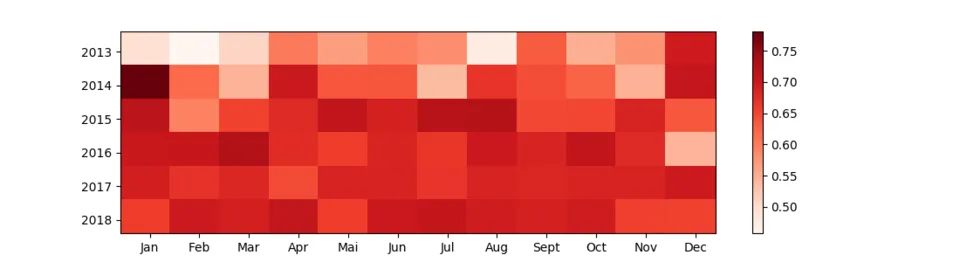
My subjective comment on the chart: I find it amazing to see the spike in the January 2014. It was right when the dump started to happening but people were still super positive, talking that it'll rise back soon and it's just a correction
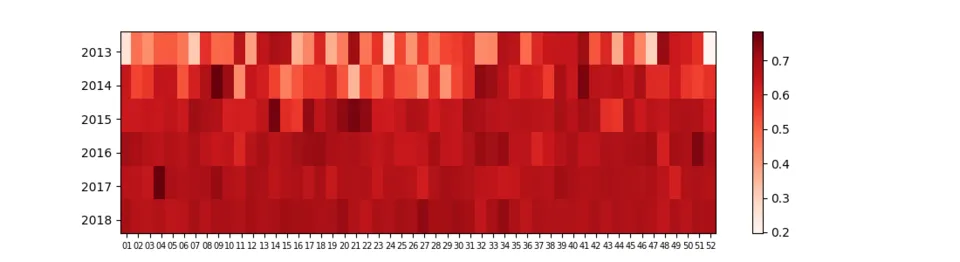
My subjective comment on the chart: Nothing really new in here..
Most frequently used words
Another very interesting aspect to look into are the repeatedly used words using wordclouds. Even more interesting is to compare two wordclouds generated from different time - usually before and after some event/change happened. If you give this a second though, the problem here is that many short words (like "and", "or", "with" and so on) are used almost in every sentence and would also show up in wordclouds. To mitigate this, I've removed list of 153 so called stopwords. Additionally I've also removed words typical for this area listed in the end of the report*.
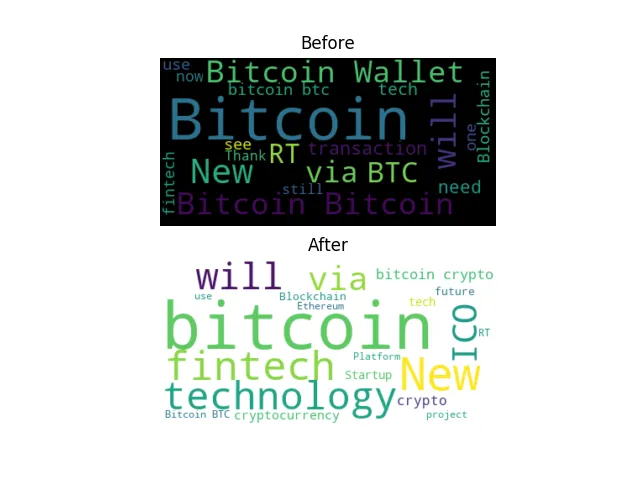
My subjective comment on the chart: Well we can see blockchain was all about Bitcoin before 2015 and still kind of is. BUT! We can see new words starting to creap in - ethereum, cryptocurrency etc. Makes total sense and I love it :)
Most frequently used UNIQUE words
As we can see in the previous worldcloud, there are many words which are actually shared in both wordclouds. That makes all the sense as there are many areas which will be forever connected with blockchain. But I went one step further and decided to create wordclouds which contain only unique words with don't appear in the opposite wordcloud.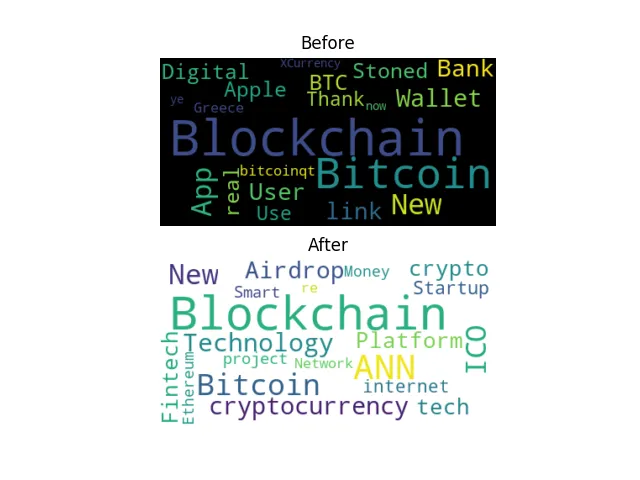
My subjective comment on the chart: This is definitely best graph from this report!!!! Such a shift in words. We can see that before 2015, words like Greece were used. Because of the crisis people had there and bitcoin could save their lifelong savings. Also words like "real" or "digital" shows the tweets were more concentrated about promoting the new unknown tech. After 2015, we can see it's all much more profit-oriented. "Airdrop, cryptocurrency, startup, money, fintech"....Honestly, I don't like this shift at all! But it's amazing to see this change in the bigger picture
* words excluded from all 4 wordclouds are: yii,bit.ly,.ly,blockchain
About project
Get your report
Interested in how's you favorite coin doing on Twitter? Or favorite athlete? Politician, actor or clothes company? . Just DM me and you'll get the full report under 48 hours :)