Head and Shoulders Pattern
Chart patterns are the foundational building blocks of technical analysis. They repeat themselves in the market time and time again and are relatively easy to spot. These basic patterns appear on every timeframe and can, therefore, be used by scalpers, day traders, swing traders, position traders and investors. There are 3 types of patterns, depending on how price is likely to behave after completion: reversal patterns, where price is likely to reverse, continuation patterns, where price is likely to continue its course and bilateral patterns, where price can go either way, depending on whether it breaks to the upside or to the downside.
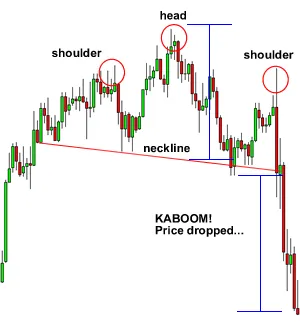
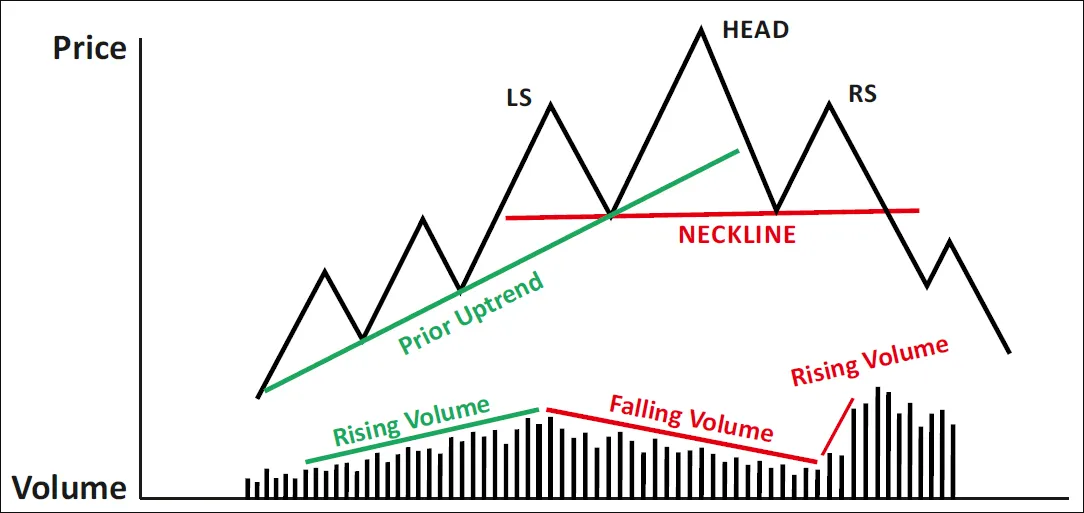
If the price breaks the neckline and closes below it, the pattern has completed. Conservative traders may look for additional confirmation. The target can be estimated by measuring the height of the pattern (from the neckline to the head) and projecting this downwards. Common stop levels are above the neckline or above the right shoulder. The Inverse Head and Shoulders is the bullish version of this pattern that can form after a downtrend.
This is the beginning of a Day trading series, i want to show everyone different patterns to watch to be able to make smarter buy in and be able to pull out at the right times.