
Welcome back traders, I hope you had a wonderful Christmas and New Year!
We're now getting back into the charts it's a brand new year, new opportunities and what a start it has been :) cryptocurrencies are through the roof!
Today I'm breaking down two assets which are breaking records and funnily enough one of cryptos most well known rivalries, ripple vs. stellar.

As you will know by now, both of these cryptocurrencies have been making headlines for the past month, their growth has been tremendous and to those who took my advice at the beginning of 2017 on both of these assets will have a very nice portfolio, I've received many kind messages with people sharing their results and that's what I love most about this business!
However, as good as all this sounds it's at times like this when investors are blinded by 10x and 20x returns, and I come along to bring them back to reality, markets move in cycles and I hate to see traders buy a market top or hold through a 95% correction.
XRP current price = $3.68
1 month ago = $0.25
STR 0.02% current price = $0.86
1 month ago = $0.09
Just take a look at those figures for a second, that's in one month alone. Similar to the moves we experienced in April/May 2017.
First, let's take a look at Ripple on the left (XRP/BTC)
As we can see from the chart the average increase is 1494% including the present price increase but not accounting for the 5412% total increase in 2017 as this was broken up by a 69% correction.
Since the beginning of December 2017 price has increased by 1890% as XRP makes headlines all over the world, it is now the second largest cryptocurrency by marketcap.
Let's take a look at the downside of these moves.
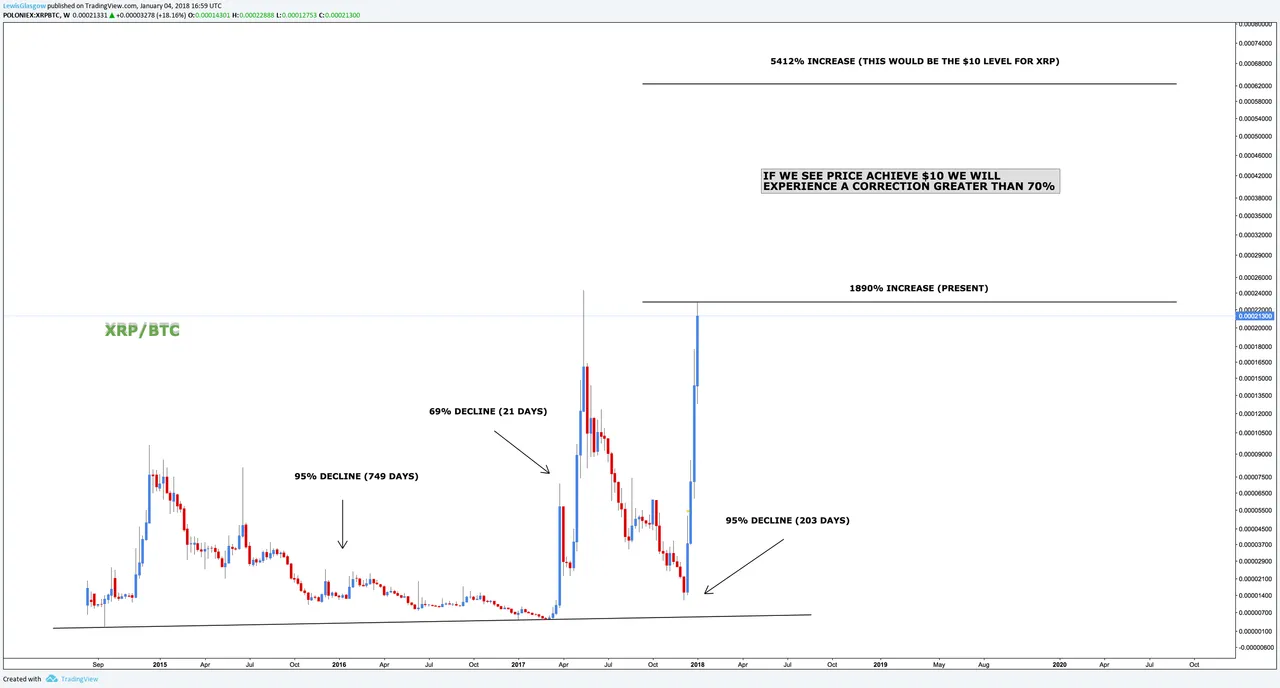
As you can see these impulsive moves are followed by a correction greater than 69% and actually two of them resulting in a 95% decline.
The average correction is 86%.
Now, picking out a market top is not simple although I have done this in the past.
If we experience a correction from the current level you can expect a correction of at least 50% before the move up continues.
A lot of individuals claim XRP will hit $10 and for their satisfaction I have included a target level for this (this price level is based on the current BTC price) which is the exact same percentage increase as we seen in 2017... The total move = 5412% from low to high.
If we do see price achieve $10 the correction to follow will be of significance, I expect XRP to lose more than 70% of its value at this price level.
Now, we have Stellar on the right (STR/BTC)
The average price increase is 2487% including the present price increase.
Since September 2017 price has increased by 2794% bringing it back into the top 10 on coinmarketcap.com.
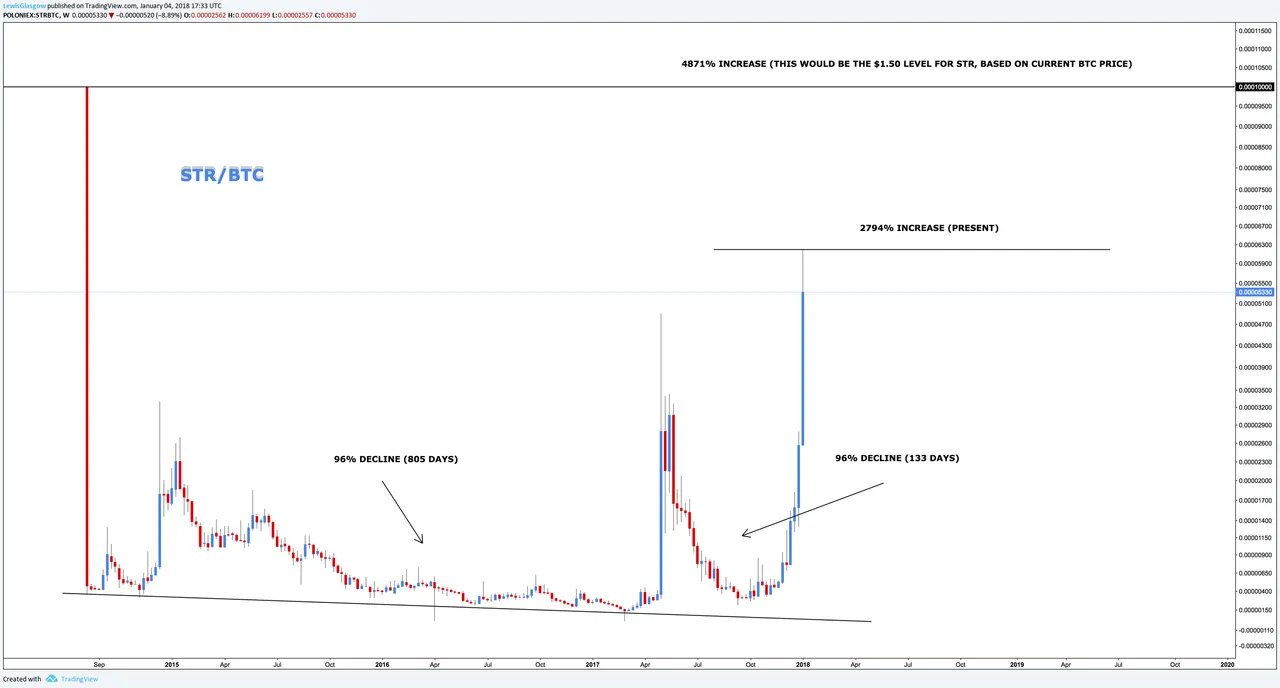
We can see that both corrections for Stellar resulted in a 96% decline which is extremely similar to XRP.
Again, I see a correction of at least 50% for Stellar very shortly.
Taking all of this analysis into account, these charts need to be compared to the asset quoted in USD, I will update this post in the future with the comparison.
I will also be updating the idea on a shorter timeframe to pinpoint where the correction will occur.
Feel free to check out my previous posts on market cycles.
Bitcoin: https://www.tradingview.com/chart/BTCUSD/roUCyXGe-Bitcoin-Cyclical-Measurements/
Altcoins: https://www.tradingview.com/chart/XRPBTC/ICQ7E2qP-Market-Comparison-What-Will-Happen-to-Altcoins/
I wish you all the utmost success in 2018.
Click here to view my original post on TradingView.
Don't forget to upvote, resteem and follow me for in-depth market analysis and investing education.