What more can I say? The bears yanked Bitcoin back into the downtrend channel and pushing it lower just when things seemed to be trying to take off again and breathe life into this stagnant crypto market. That made this chart particularly poignant to see when Binance helpfully printed "6666.66" as the new low briefly.
So what's happening with Bitcoin since my last update? Well, we've seen a number of traders and analysts who's patterns were calling for return of the bulls not fulfill. Even my own TA suggested we were coming to the apex of a symmetrical triangle, that had more probability of breaking up than breaking down.
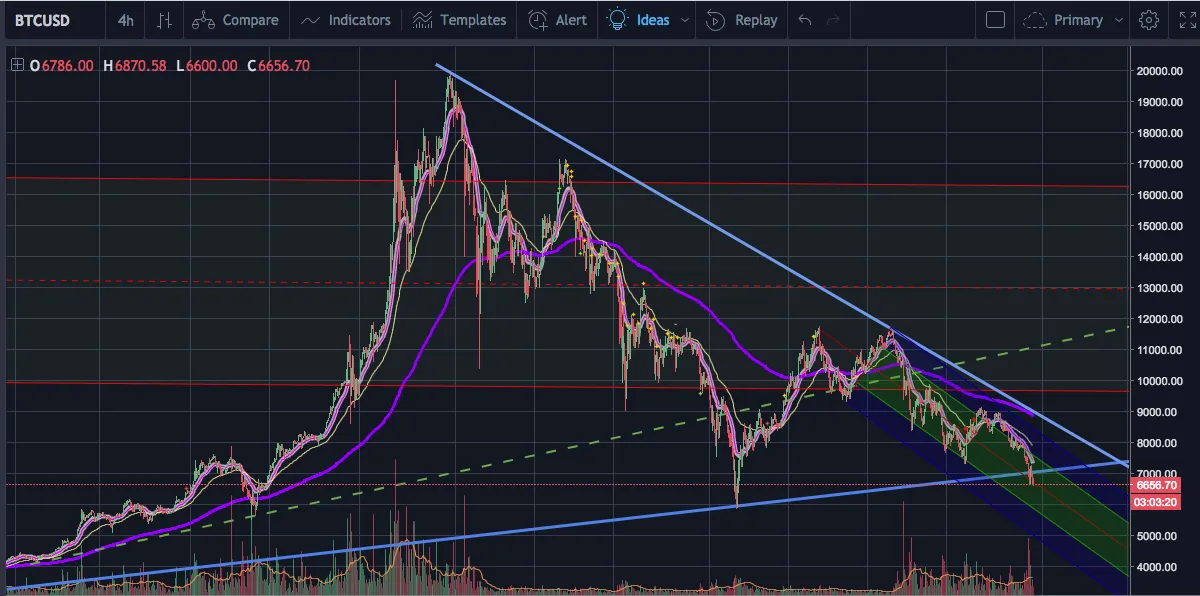
I was actually feeling confident that the downtrend pitchfork I had drawn a couple weeks ago should be removed and let the triangle rule, but alas, as of this morning, we have broken below the blue line's support, so we're in very choppy waters for now.
Since I am not a seasoned trader (I've only been trading since Oct/Nov '17) and am much more an investor, my own reaction here is to short Bitcoin by trading out to a stable coin and letting Bitcoin fall for a while and buying back in at a new low. The reason being, I see no "next support" to bet on. It's in free fall, which may, at any moment, reverse itself sharply, or continue on down. Which means we have to start zooming out to daily charts and looking at fractals and Fibonacci levels to try to gauge where the next support level is. When you do that, you get this chart:
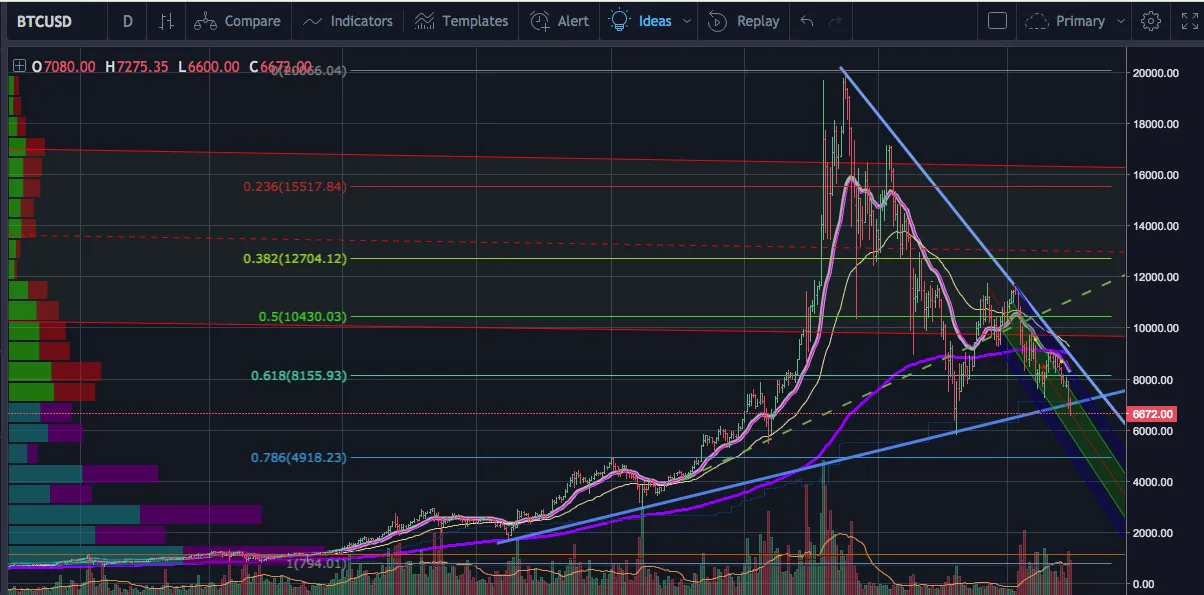
So, next support level is at Fib 0.786, which is $4918 USD. What I find interesting here is that the volume/price bars (horizontal bars on left) are also showing support at $4900 range, so we know a large number of HODL'ers are here and this further backs up the Fib numbers.