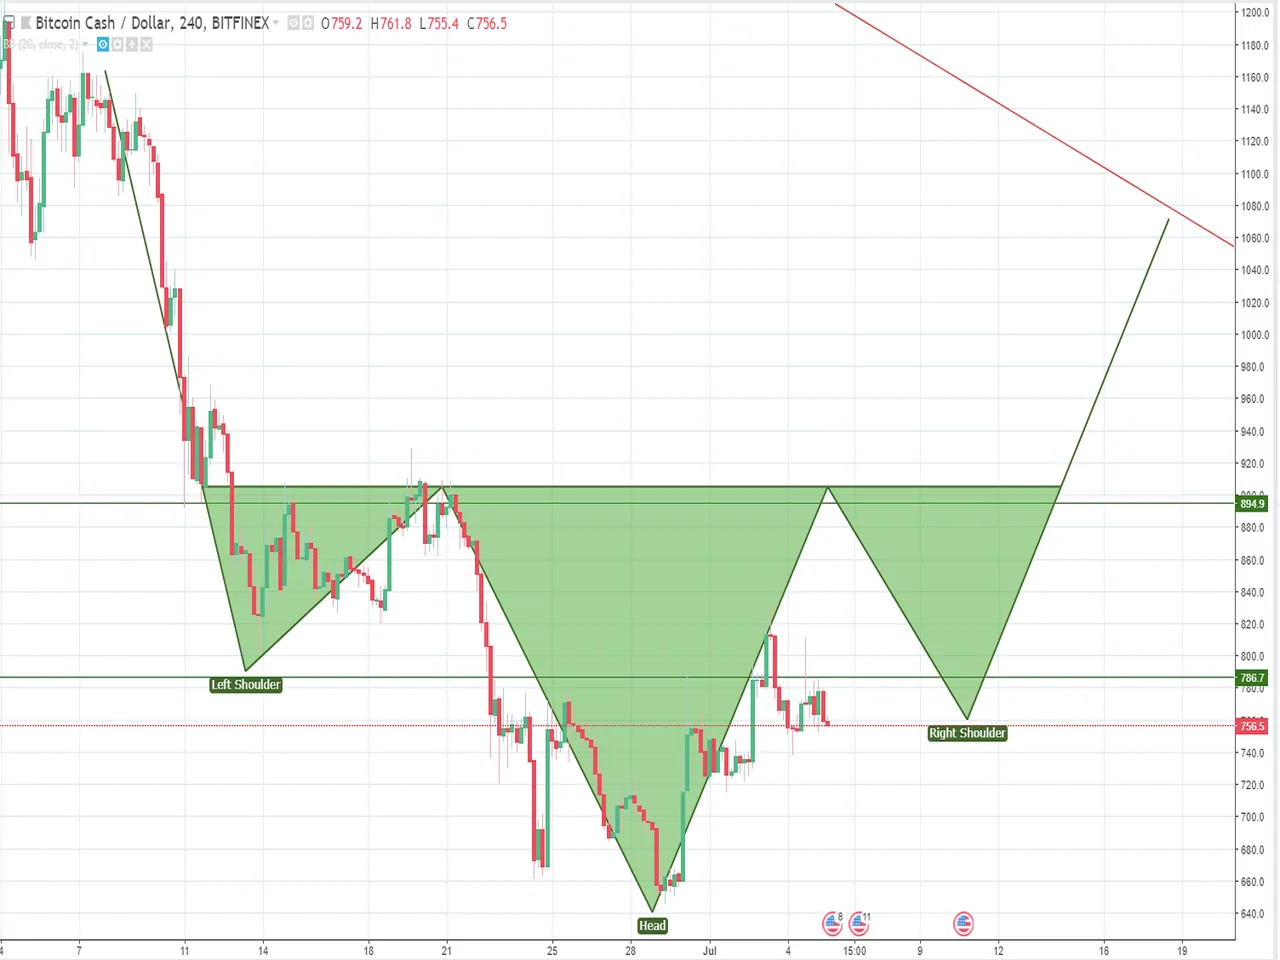
According to chart H4, there is a chance that the Head and shoulder pattern will be formed within the chart Bitcoin cash. If it comes true, the Bitcoin Cash price is likely to tick up to the key level of $894 (as the neckline level) before sliding down back to the support level of $786 in order to accomplish the right shoulder pattern.
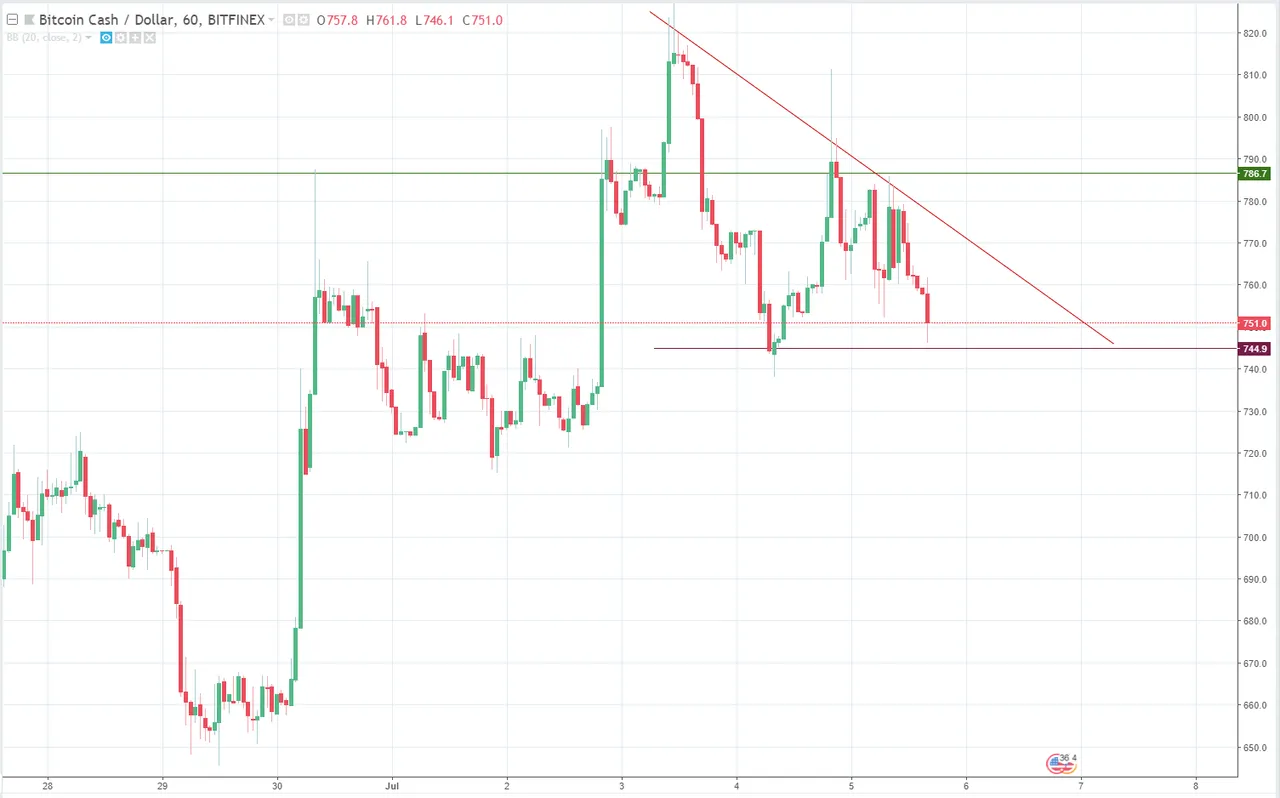
In chart H1, a Descending triangle seems to be constructed within Bitcoin Cash price chart after a steep uptrend. However, the Bitcoin Cash price has just touched the lower trend line once time only, so the price is likely to fluctuate in the pattern for a while before a breakout can take place.
From @daigv
For more crypto price forecast: check it out nami.today