StellarBTC made a high of ~0.00006299 on Jan 3, 2018 after which it sold off. The price action from the ~0.00006299 to the current price (~~0.00003219 as at the time of this publication) can be described by a 3 wave (A-B-C) move that is a regular flat (3-3-5) Elliott wave structure.
This structure implies either (1) The resumption of an impulsive move once the regular flat is complete OR (2) Another 3 wave move back upwards for StellarBTC. Either scenario calls for a move back up in the price of Stellar .
Possible termination points for the wave C of regular 3-3-5 based on a wave A are 123.6% and 138.2%. This gives a projection point of ~0.00002984 and ~0.00002662 respectively. These termination points are indicated by the purple lines
These termination points also coincide with support drawn (green lines) by chart inspection for StellarBTC .
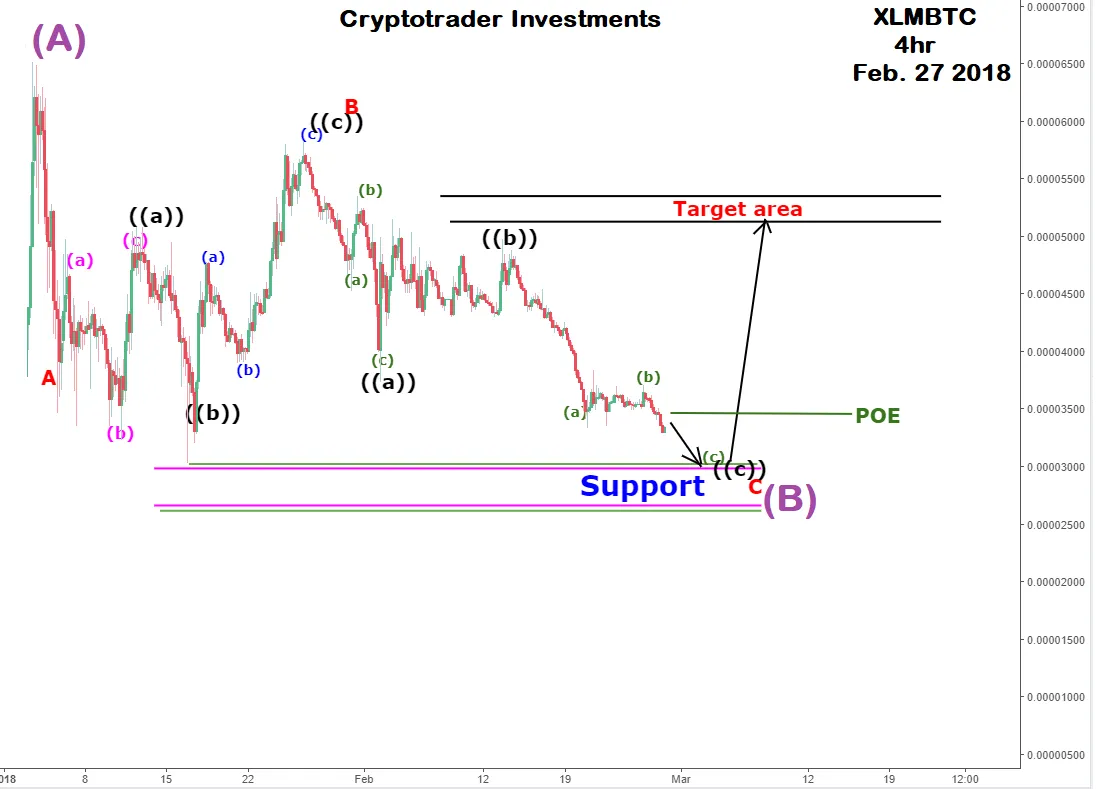
This creates a region of price cluster and therefore has a likely chance of StellarBTC targeting it (i.e. support)
ONCE and IF price hits this support area , possible opportunity to go long would be to buy on a breakout above the POE (Point of entry) into the trade at ~0.00003457 and place a stop loss just below the upper range of the support at ~0.00002948.
Using this IDEAL scenario gives a risk of 509. Reward = 0.00005127 (bottom range of the target area)- 0.00003457 = 0.00001670
Risk/Reward ratio = ~3.3:1
(Range of the Target area = 0.00005127 and 0.00005357)
Disclaimer: This is meant for information purposes ONLY and not a recommendation to buy or sell XLMBTC