My previous post for Ethereum Classic (ETCUSD) can be found here:
https://www.tradingview.com/chart/ETCUSD/7lucYVEq-Wave-analysis-for-Ethereum-Classic-4hr-tf/
It was mentioned in the previous post that Ethereum Classic (ETCUSD) was expected to continue selling off and likely target support as indicated in the previous post. Ethereum Classic (ETCUSD) at the time of this post is consolidating just below the support region (also shown here also with horizontal red lines as in the previous post).
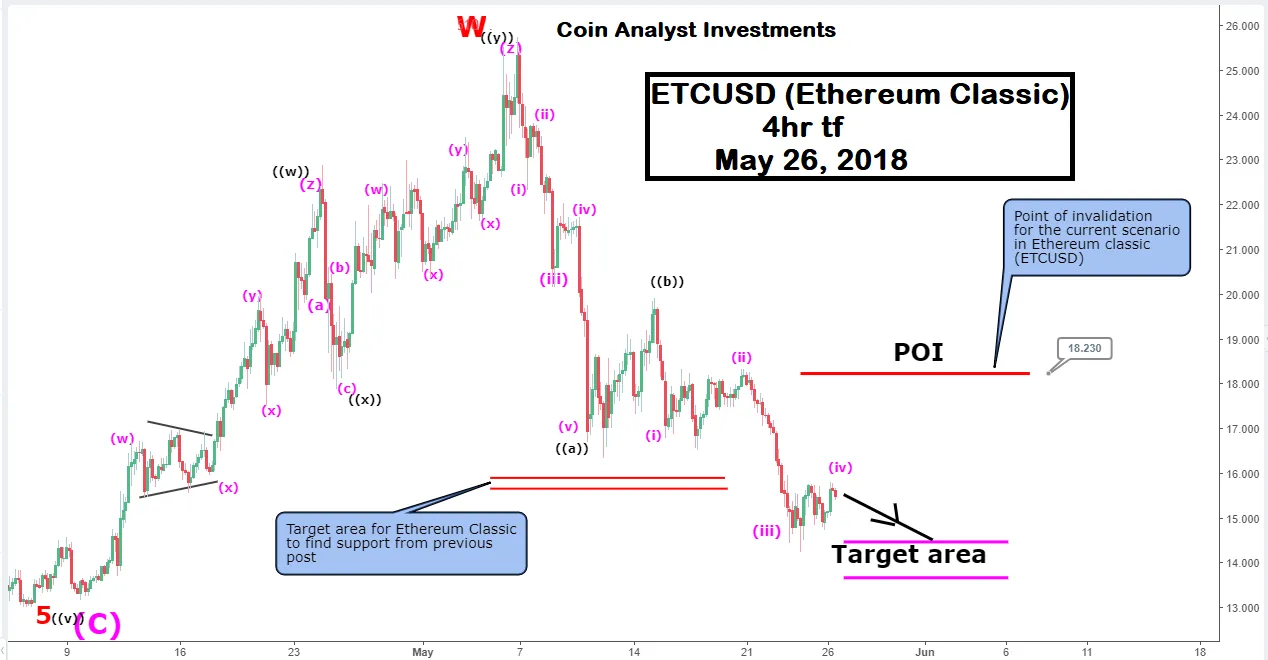
Price action from ~$25.32 on May 7 2018 to the time of this post has been updated and identified as a 3 wave zigzag Elliott wave structure. Target area for the termination of the structure is indicated on the chart (~$14.51 and $13.67).
Point of invalidation (POI) for the current scenario is a price close above ~$18.23 at which point wave (iv) would have overlapped wave (ii) for the current minute wave ((c)) position.