When investing in crypto, I notice that a lot of people around me don't take one specific metric into account that I personally always check: the percentage of supply issued.
Why do I look at this? Simple: inflation.
When you go to CoinMarketCap.com like most of us, you see a particular order of all projects. So currently Bitcoin is number 1, Ethereum is number 2, Stellar is number 8 and Ontology is number 28. These ranks are based on latest sale price times circulating supply. This is a tricky ranking system if you ask me.
As you probably know, every day some extra Bitcoins are mined into existence. The same counts for coins of a lot of other projects. This means that the circulating supply slowly increases, which causes inflation. This is just like inflation created in fiat money when the FED or European bank prints USD or EUR. When they do this, the USD or EUR on your bank account become less valuable.
This 'printing' in the crypto space doesn't happen with the same speed for all coins, but there are big differences with a different inflation rate as a result. The function baked into the protocol that determines the inflation can be different as well as the point in time on that function we are currently at. This means there can be a big difference between the circulating supply now and the maximum supply of that coin (like Bitcoin's 21 million).
Next to that, there are a lot of projects nowadays that release tokens. In their crowdsale they only sell a portion of the total tokens and keep some for the team, advisors, community, reserve etc. This means that the circulating supply, can be much lower than the total supply. Once those other tokens are sold on the market this may cause inflation.
So we have circulating supply that determines the ranking on CoinMarketCap, but it would be strange to not take into account inflation and therefore implied marketcap when we know there is going to be more circulating supply in the future, right?

Image source
Taking % of supply issued into account
So let's check what the ranking of all coins would be if we take into account the maximum supply instead of just the circulating supply.
Personally I use OnchainFX to check for the metric "% of Supply Issued" (see most right column below). If you prefer to use CoinMarketCap, you can find the details on max supply on the main page of each coin.
On CoinMarketCap we see the following:
- Bitcoin - Rank 1
- Ethereum - Rank 2
- Stellar - Rank 8
- Ontology - Rank 28
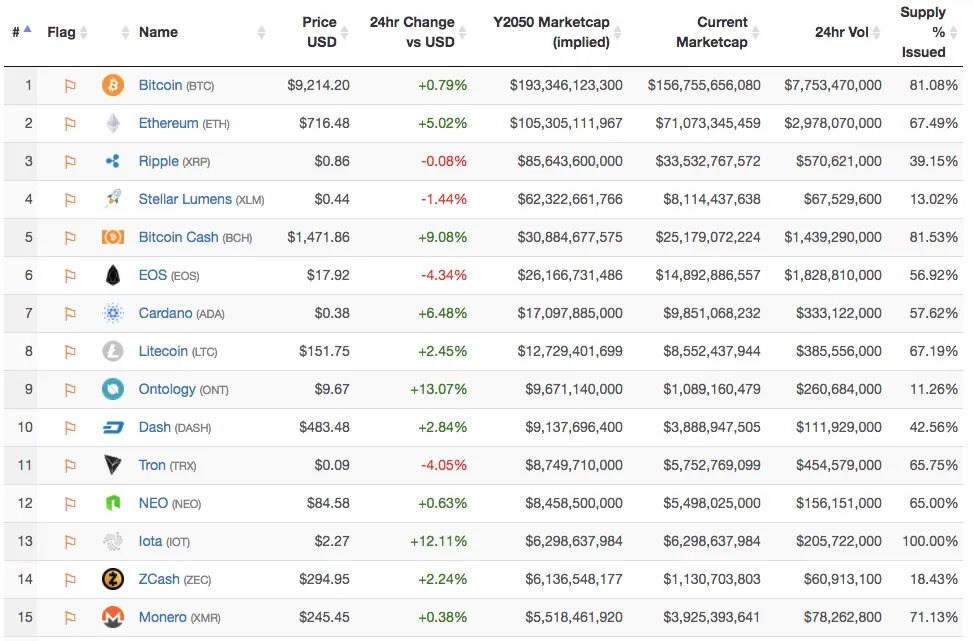
But when we look at the ranks on OnchainFX, based on implied marketcap in the year 2050, we see something very different:
- Bitcoin - Rank 1 (81.01% of supply issued)
- Ethereum - Rank 2 (67.49% of supply issued)
- Stellar - Rank 4 (13.02% of supply issued)
- Ontology - Rank 9 (11.26% of supply issued)
Very different ranks for Stellar and Ontology here! There is a lot of inflation to be expected and we should not ignore that.
Of course, we don't know whether that has been already priced in, but looking and comparing with other projects I don't think it is and a lot of people just didn't take a good look at these numbers yet. Did you?
I hope I inspired you to take a look at the right numbers :-)
I'm curious what your thoughts are on the matter. Do you look at the circulating supply or do you take the maximum supply into account? Do you think it is valuable to do that or not?
---> 👍🏼 Follow me for regular updates on my cryptocurrency portfolio, crypto related articles and inspiring articles about personal time & life management.
---> 👍🏼 Resteems and upvotes are appreciated ;-)
Disclaimer: I am not a financial advisor, trader or developer. I am just a blockchain & cryptocurrencies enthusiast. Make sure you do your own research, draw your own conclusions and do not invest any money that you cannot afford to lose.