
Ethereum price has been seeing an upward trend throughout the past 48 hours surpassing $670 at the time of writing of this analysis. On Monday’s trading sessions, Ethereum (ETH) Price rose from a day low of around $600 to a day high of $650, recording all time highs from past 30 days. The market is still moving according to the uptrend line that has been evident across the 1 day charts since April 7th.
Will ethereum price continue on rising during the next 24-48 hours?
ETHEREUM ALMOST OVERSOLD ON THE 1 HOUR ETHUSD CHART:
Let’s examine the 1 hour ETH/USD chart from Bitfinex, while plotting the 50 period SMA, the Stochastic oscillator, and the Ichimoku Cloud, as shown on the below chart. with ATH recorded on January 13th, 2018 ($1,424.06). We can note the following:
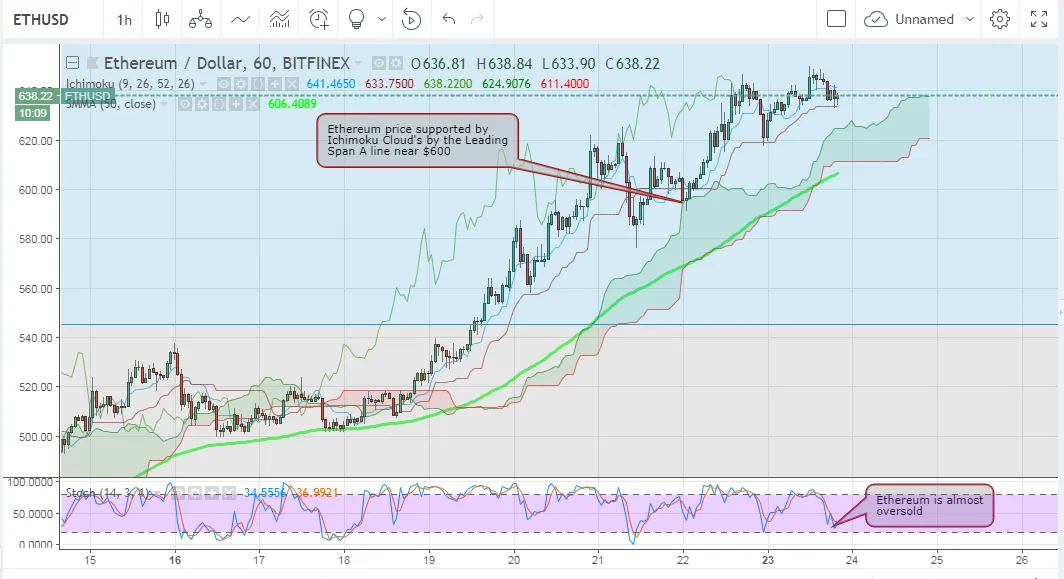
Ethereum price was down temporarily below Ichimoku Cloud’s Base Line (red line) on Sunday, yet the cloud’s Leading Span A line (green line) holded the market near the $600 price mark, which prevented further price dip. As soon as candlebars rose above the Base Line, ethereum began soaring again. During all of Monday’s trading sessions, candlesticks didn’t fall below cloud’s Base Line level.
Ethereum price is still above the level of the 50 period SMA, and has been so since April 17th. As long as we are above this moving average, the bullish momentum will keep on pushing ethereum price to higher levels.
The Leading Span A line (green line) of the cloud is approximately near the $635 price level now, so we can expect that ethereum price wil probably remain above this price level during the upcoming 24 hours.
The value of the stochastic oscillator is currently around 24, which is only 4 points away from the oversold bar of 20. As such, we are most likely to see ethereum price continue on rising where the market would be more stable.
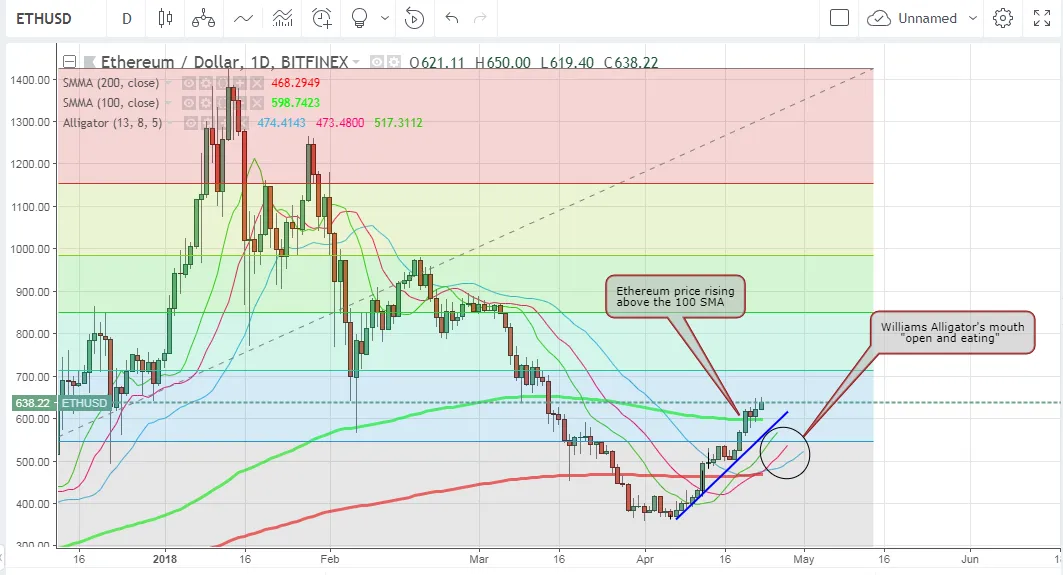
RISING ABOVE THE 100 PERIOD SMA ON THE 1 DAY ETHUSD CHART:
Let’s examine the 1 day ETHUSD chart from Bitfinex, while plotting the 100 period SMA (green curve), the 200 period SMA (red curve), and the Williams Alligator indicator, as shown on the below chart. We will also keep the same Fibonacci retracements we plotted above. We can note the following:
 ![ethereum.jpg]
- Ethereum price rose above the 200 period SMA on April 12th, and it rose above the 100 period SMA on April 20th. The rise above these two moving averages reflects the bullish sentiment of the market. The 100 period SMA is now acting as a support level as shown by the relatively downwards shadows of candlebars near the level of this moving average.
- Williams Alligator’s SMAs are exhibiting a bullish alignment, and we can say that the alligator’s mouth is currently “open and eating”. As such, we can expect ethereum price to continue on rising towards the resistance around $713.24, which corresponds to the 61.8% Fibonacci retracement, during the next 1-3 days.
CONCLUSION:
Ethereum price continued on rising to record a day high of $650 during the past 24 hours. We can expect ethereum price to soar towards $700 during the next 1-3 days, as per our technical analysis.
Charts from Bitfinex, hosted on Tradingview.com