I just did a video on Bitcoin vs Bitcoin Cash but wanted to make a modified summary for the community here on Steemit.
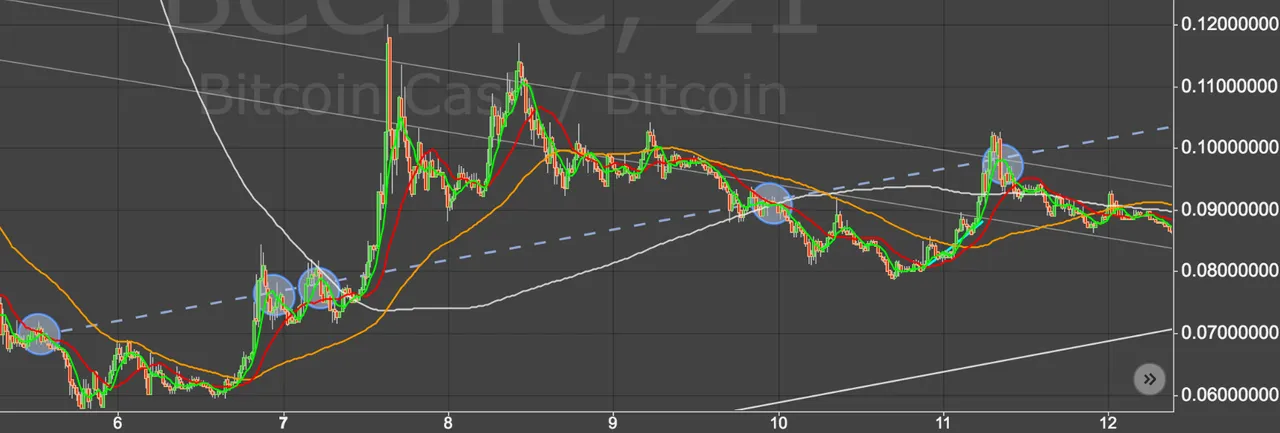
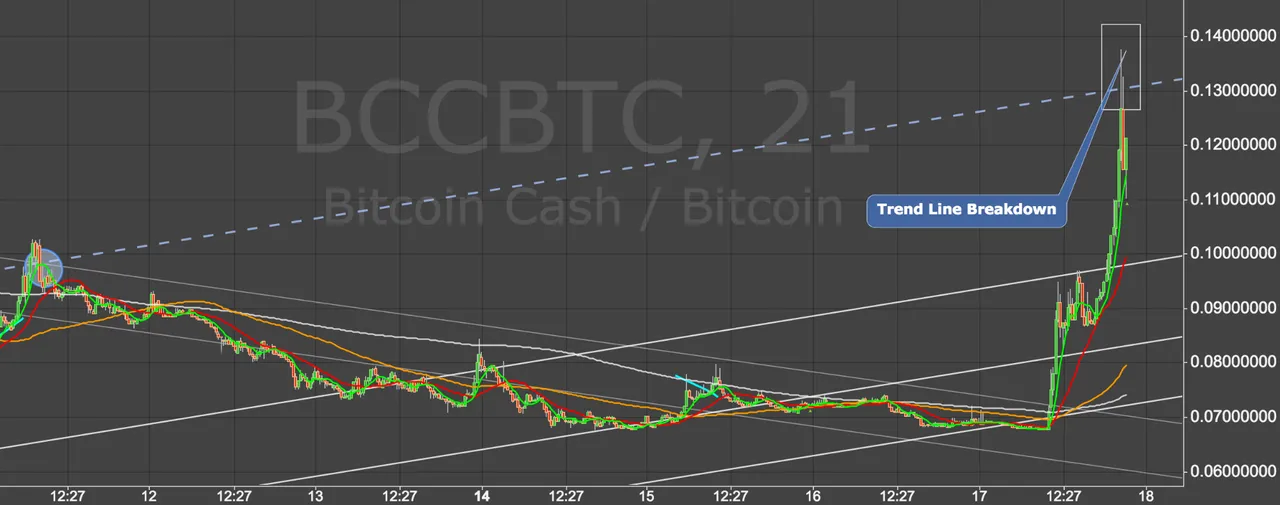
While I was live on the air I found a very notable trend line that predicted to the moment BCH would break down. This trend line captures data all the way back from August 5th and confirms 5 times over the next few days - not including the one tonight.
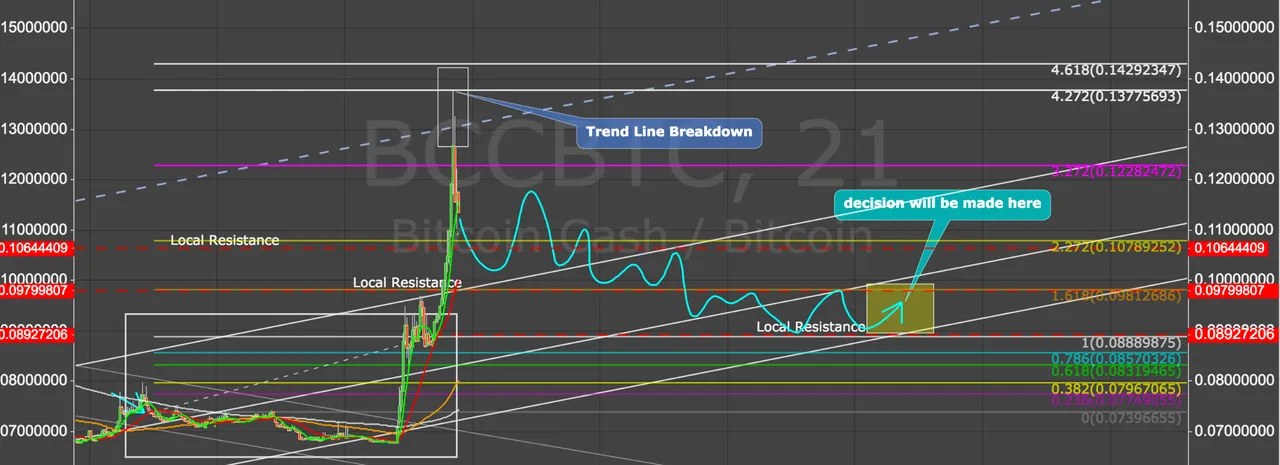
So now it looks like Bitcoin Cash will step down through the different levels until it finally consolidates right around 0.89. The charts say this should occur somewhere during the 100 year eclipse on August 21st. I think this is actually a symbolic shift in the crypto world - where BCH becomes one of the stronger long term coins in this shift moving into the new digital economy.
A quick fib extension from the two local break down points confirms this range of expected consolidation levels.
I apologize if this information is unclear through pictures and snapshots - I speak much more in depth in my videos - but wanted to create the charts specifically for the SteemIt community as well!
Please Re-Steem if you find this type of information useful and I will be sure to follow-up with much more in depth charts in the future. It is my sincerest effort to empower as many people as possible through being profitable in the markets. Also if you have any requests for charts - please leave them in the comments below.
Stay Cryptic Ya'll.
Peace.
-BK