SLS - BTC (BITTREX)
1DAY CHART
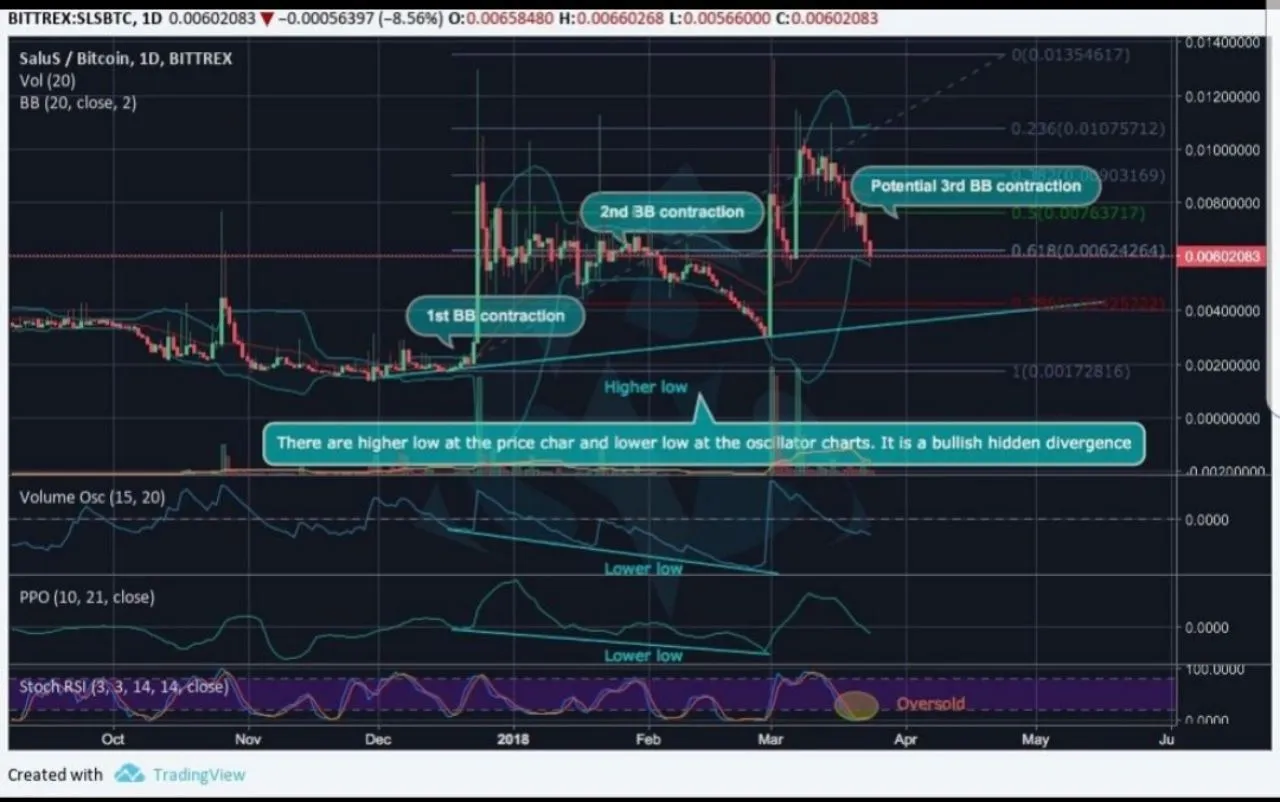
We can see that the analysis started with the Bollinger Bands indicator, it was found that before of every major growth of this currency there is a contraction in the BB channel, and now
a similar contraction is forming. In addition, the price touched the support level of Fib 0.618 and began to bounce. Stoch RSI reinforces this idea. There is a greater decrease in the price chart and at the same time a lower decrease in the oscillator table, which means that there is a hidden bullish divergence. I recommend SLS in the mid term.
Current price: 0.00600000