In this episode, we will examine Rectangle chart patterns. We will go over :
- What are Rectangle Chart Patterns?
- Bearish Rectangle
- Bullish Rectangle
- Requirements for a Rectangle Chart Pattern
- What to do while the price in the box.
 Source

Rectangle Chart Patterns
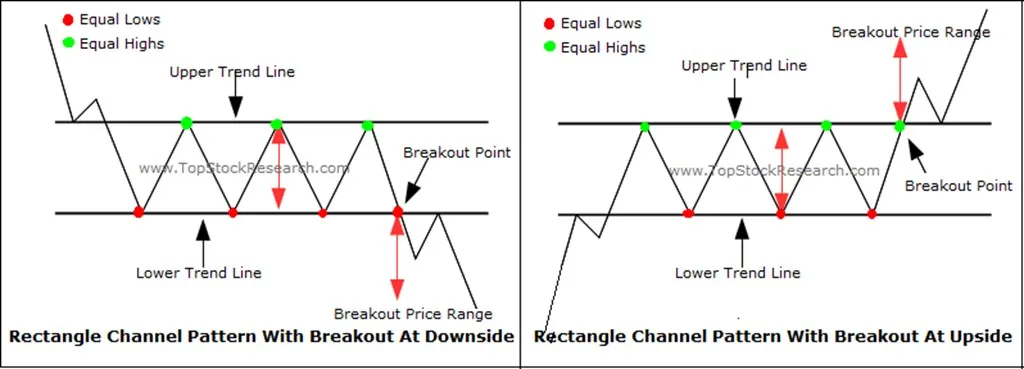
- It is defined by horizontal trendlines. Known as Continuation Pattern.
A rectangle is formed when the price is bordered by the parallel support and resistance lines.
Indicates a period of consolidation or sometimes indecision of traders about the currency.
The price tests support and resistance lines many times before an eventual breakout.
 Source
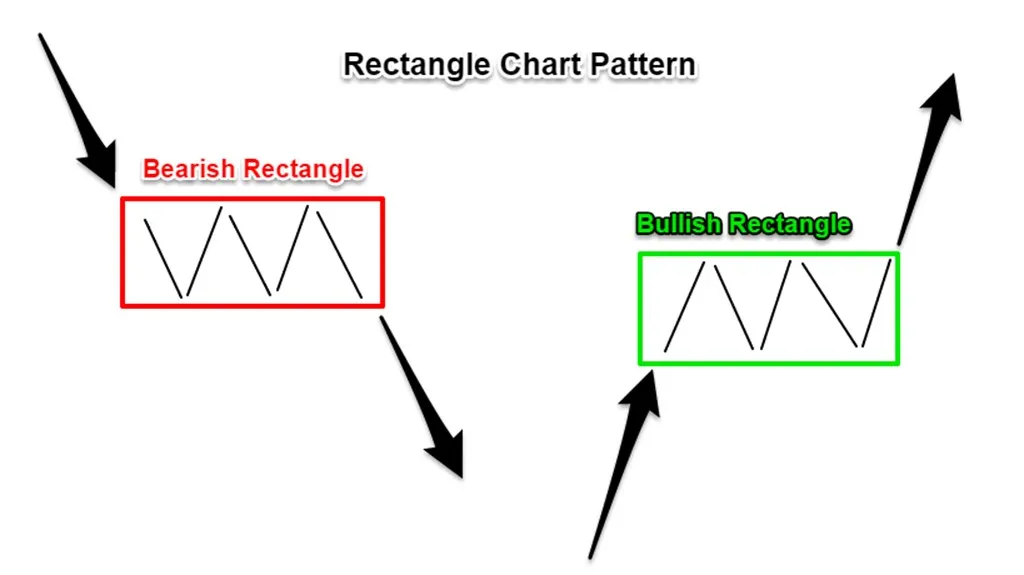
Bearish Rectangle
The price consolidates for a while during a downtrend.
In another word, the price strains in a box in a falling action.
Once the price drops below the support level permanently, it tends to make a progress approximately the same size as of the rectangle's height.
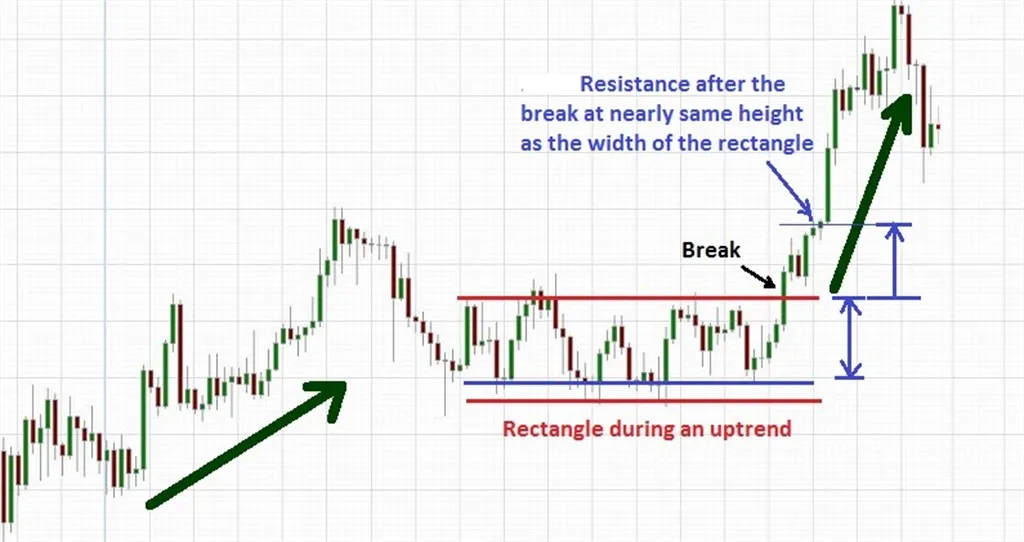
Bullish Rectangle
After an uptrend, the price consolidates for a while ;
Once it breaks the resistance level, it makes nearly the same size upward movement as the rectangle pattern.
 Source
While Trading with a Rectangle Chart Pattern
- Trend: There must be a prior trend.
- 4 Points: At least 2 times tests of support and resistance lines is needed.
- Volume: High volume is a favor to confirm the breakout.
- Target: The expected move is demanded to be at the same height as the rectangle.
 Source
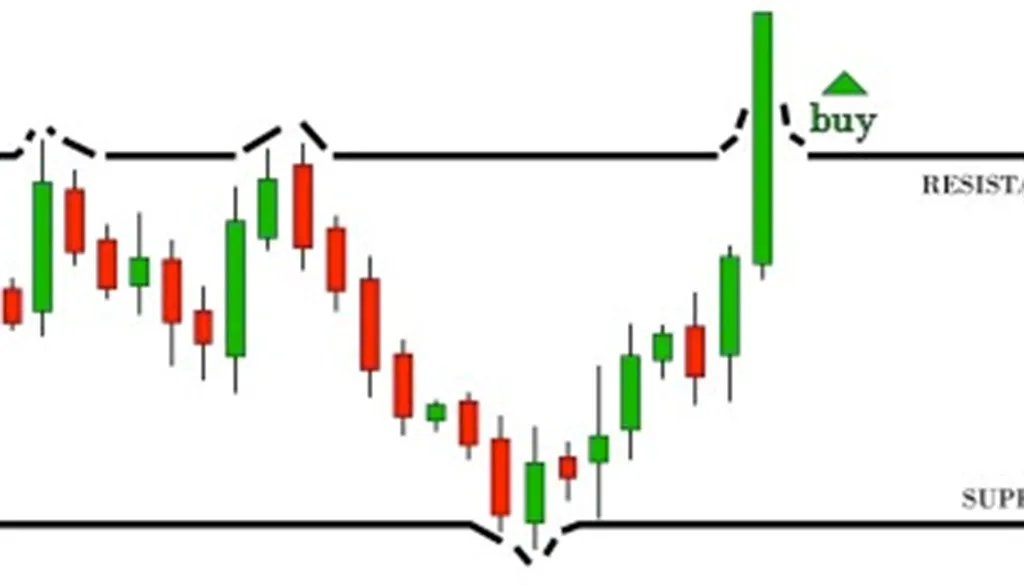
While the price is in the box
One of the safest trade strategies can be applied --> Buy at Support; Sell at Resistance...
Whereas trading with this strategy, do not forget spotting stop-loss orders to minimize the risk of losing your money.
Crypto-Education Series Episode 12
Crypto-Education Series Episode 13
Crypto-Education Series Episode 14
Crypto-Education Series Episode 15
Crypto-Education Series Episode 16
TURKISH
Bu bölümde dikdörtgen grafik şablonunun üzerinden geçicez. Sırasıyla
- Dikdörtgen Şablonlar nelerdir?
- Olumlu Yönde Dikdörtgen Şablon
- Olumsuz Yönde Dikdörtgen Şablon
- Şablon Gereksinimleri
- Fiyat Dikdörtgen içerisinde iken neler yapılmalı?
Source
Dikdörtgen Şablonlar
Devam bildiren şablonlardandır. Yatay trend çizgilerinden oluşur.
Fiyatın yatay seyirde destek ve direnç noktalarında seyir etmesiyle gerçekleşir.
Bir sağlamlaşma süreci ya da tacirlerin kararsızlığı sonucu ortaya çıkar.
Fiyat defalarca destek-direnç seviyelerini test ettikten sonra güçlü bir şekilde kırar.
Source
Olumsuz Dikdörtgen
Fiyat düşüş trendinde bir süre konsolidasyon yaşar. Diğer bir deyişle, kutunun içinde sıkışıp kalır.
Fiyat destek noktasının altına düştüğünde, dikdörtgenin boyutu kadar düşüş yaşaması beklenir.
Olumlu Dikdörtgen
Bir yükselen trend sonrası, fiyat bir süre sağlamlaşma yaşar ve bu kutu görünümü gerçekleşir.
Fiyatın direnç noktasını kırmasıyla, dikdörtgenin boyutu kadar yükseliş beklenir.
Source
Dikdörtgen Şablonun Gereksinimleri
- Trend : Daha öncesinde mutlaka bir trend olmalıdır.
- 4 Nokta: Fiyat en az 2 defa destek ve direnç noktasını test etmiş olmalı.
- Hacim: Fiyatın kırılmada yüksek bir hacimle çıkış ya da düşüş yapması beklenir.
- Hedef: Kırılma anında Dikdörtgen boyutu kadar düşüş ve ya yükseliş gelir.
Source
Kutunun içinde alım-satım
En güvenli alım-satım işlemlerinden birisi kuşkusuz --> Destekte al; Dirençte sattır.
Bu strateji Dikdörtgen Formasyonunda uygulanmaya elverişlidir.
Uygularken, kayıp önleyici (stop-loss) kullanmakta riski en aza indirmek adına kesinlikle fayda var.