
Crypto users can now buy on e-commerce sites, including Amazon, using the lightning network. Crypto processing startup Moon has tied up with a financial institution that will convert crypto to fiat on the backend because Amazon still doesn’t accept crypto. However, this shows that the crypto companies are trying to increase the use of cryptos in day to day dealings.
The current recovery from the lows will need a trigger to continue its upmove. Involvement of institutional traders will be an important event that can boost prices. It is expected that the Bakkt platform will attract institutional investors with its bitcoin futures offering. However, the launch has been postponed many times due to regulatory complications. Therefore, the company is exploring options to seek a license from the New York Department of Financial Services, which might increase its chances of getting the go-ahead from the Commodity Futures Trading Commission (CFTC).
After the recent recovery from the bottom, bullish voices have increased. However, we believe that a correction to shake out the weak investors is likely. That should be a great opportunity to enter for the long-term. We advise against chasing the up move. Let’s look at the top 5 cryptocurrencies by market capitalization and identify if we spot any buy setups in them.
LEARN HOW TO TRADE CRYPTOCURRENCY WITH A MASTER CRYPTO TRADER!
BTC/USD
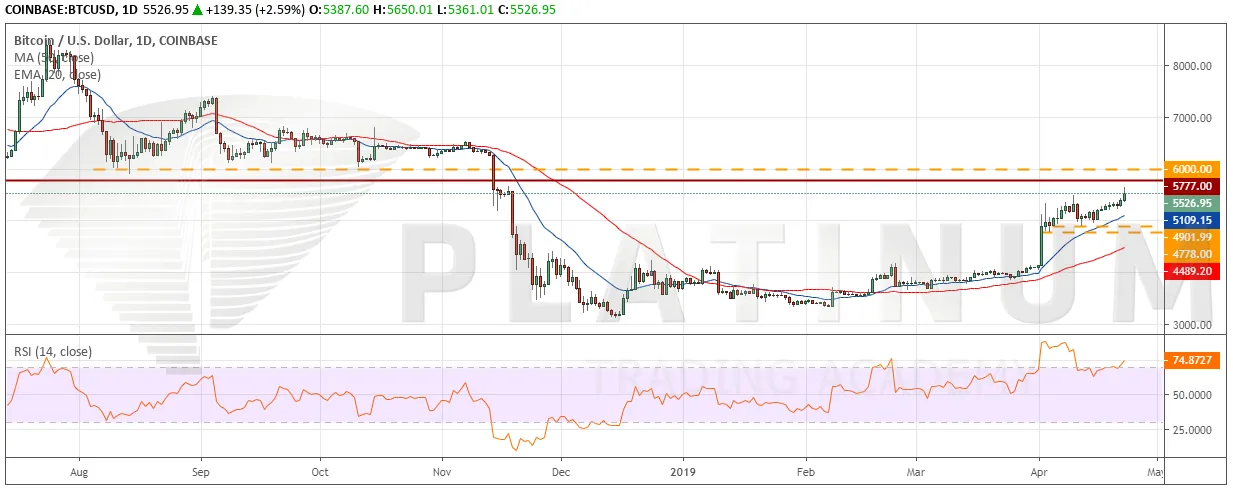
The trend in Bitcoin remains up as both the moving averages are sloping up and the RSI is in the overbought zone. We like the way the digital currency has remained overbought for the past few days. This shows that the bulls are keen to buy at every higher level as they don’t expect a retest of the lows.
Bitcoin has been rising gradually for the past few days. It has broken out of the immediate resistance at $5,488 and can now move up to the $5,777-$6,000 resistance zone. We expect a lot of supply in this zone that can start a correction or a consolidation. But if the bulls ascend this resistance zone, it will force the traders sitting on the sidelines to jump in resulting in a spike to $6540.
On the downside, the first support is at the 20-day EMA and if it breaks, the next support zone is $4901.99-$4778. We expect the bulls to defend this zone. As the price is close to the stiff resistance zone, we don’t find any buy setups at the current levels.
ETH/USD
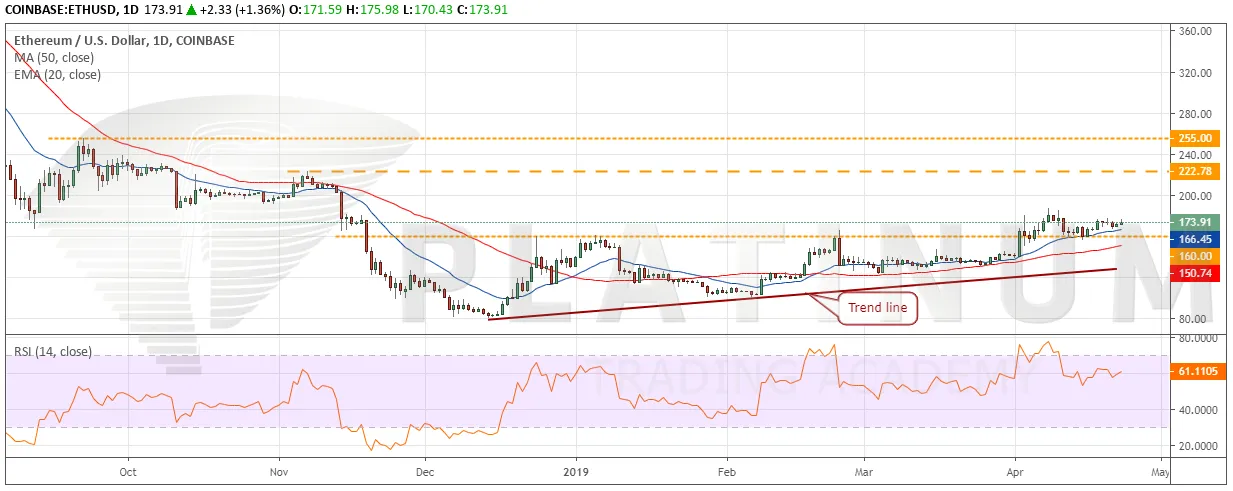
Ethereum completed the ascending triangle pattern on April 02 and successfully held the retest of the breakout level on April 15. It has a target objective of $239.4. The trend is bullish as both the moving averages are trending up and the RSI is in the positive territory.
However, currently, the bulls are facing resistance in the $180-$187.62 zones. A breakout of this zone will propel the digital currency to $222.78, which is the next resistance. Traders can buy above $188 and keep a stop loss of $154. This is an aggressive trade, hence, please use only 50% of the usual allocation.
On the downside, support is at the 20-day EMA and below it at $160. We expect the bulls to defend this support zone. However, if the bears sink the cryptocurrency below $160, it can correct to the 50-day SMA.
XRP/USD
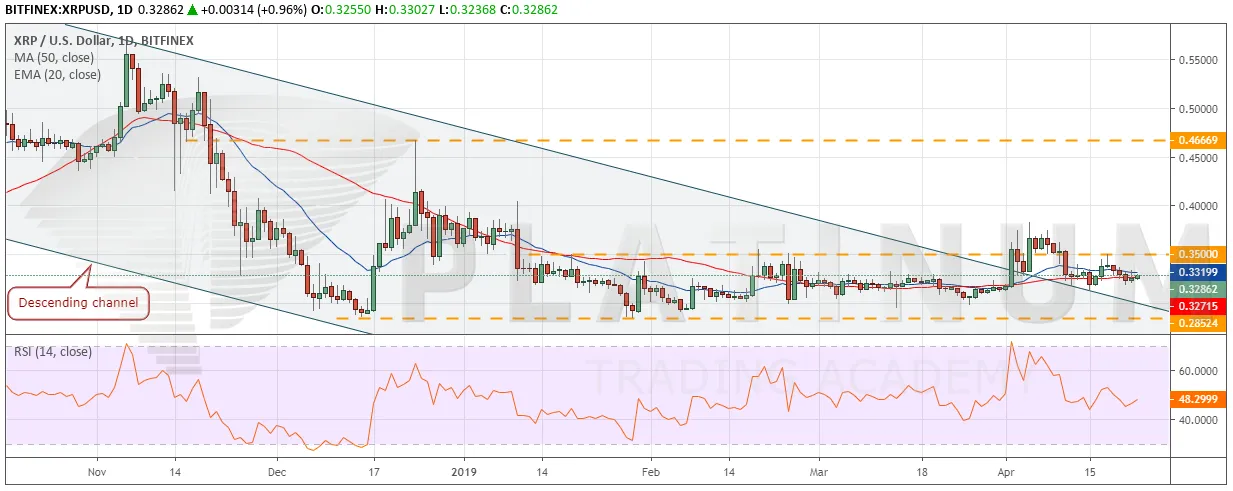
Ripple has broken out of the descending channel, which indicates that the downtrend is over. Currently, the price is stuck in the $0.28524-$0.35 range. Both the moving averages are flat and the RSI is close to the 50 level, which suggests a range bound action for a few more days.
A breakout and close (UTC time) above $0.350 will be the first signal that a new uptrend is likely. The cryptocurrency will pick up momentum above $0.38353. The targets to watch on the upside are $0.46669 and above it $0.53127. Traders can buy on a close (UTC time) above $0.350 and keep the initial stop-loss at $0.28, which can be trailed later.
Our bullish view will be invalidated if the bears sink the digital currency back into the channel. The bears will gain an upper hand on a breakdown of $0.28524.
BCH/USD
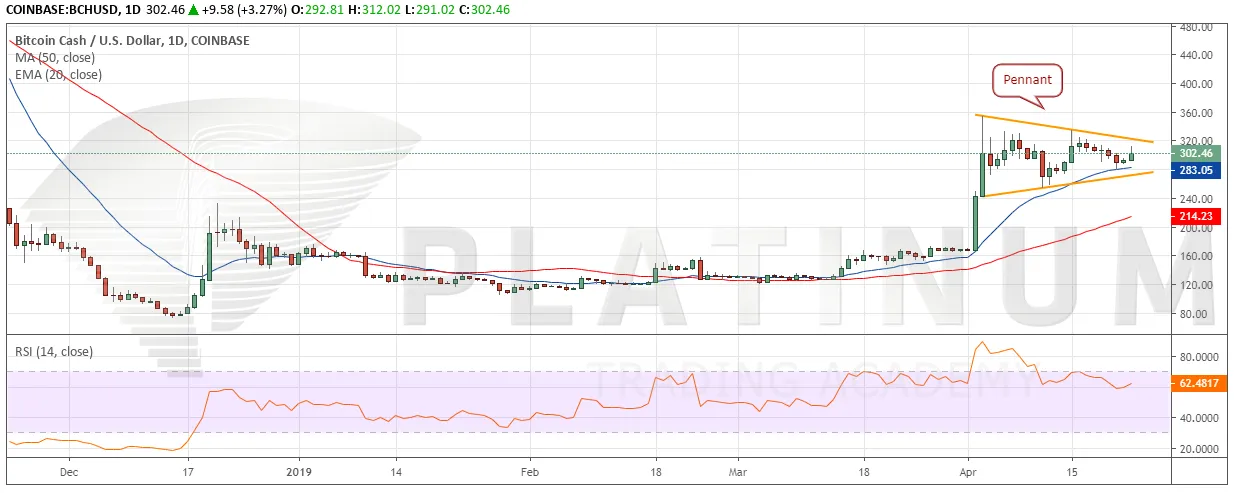
Bitcoin cash is in an uptrend with both the moving averages sloping up and the RSI in the positive territory. It is currently consolidating inside a pennant after the sharp rally on April 02 and 03. A breakout of the pennant will resume the up move that has a pattern target of $441.36. The digital currency has a history of vertical rallies; hence, the price might surprise to the upside.
Traders can buy on a breakout and close (UTC time) above the pennant and keep a stop loss of $260. If the bulls struggle to scale above $354.17, traders can tighten their stops. Contrary to our assumption, if the price turns down from the overhead resistance and plummets below the pennant, it will weaken and can drop to the 50-day SMA.
EOS/USD
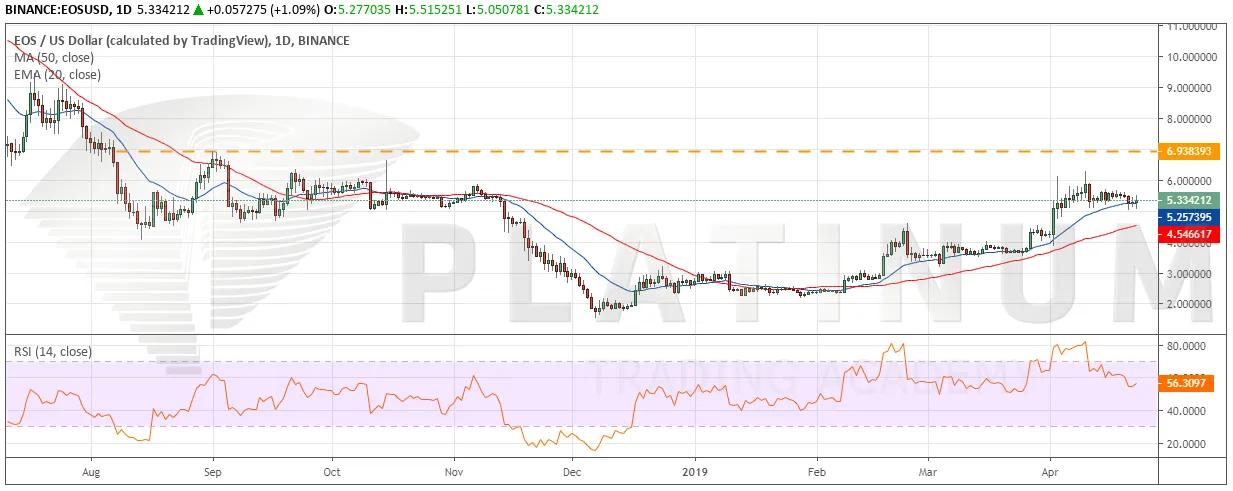
The trend in EOS remains up. It is currently trading above both the moving averages that are sloping up and the RSI is in the positive zone. This suggests that the bulls have the upper hand.
The price is currently taking support at the 20-day EMA, which is a bullish sign. Whenever the bulls defend the first support level, it is a sign of strength. They are likely to try and push the price above the overhead resistance of $6.276077. If successful, a rally to $6.938393 is probable. We expect this level to act as a major roadblock. But if the bulls scale above it, a quick move to $9 is possible.
Our bullish view will be negated if the virtual currency turns around and dives below $5. The next support is the 50-day SMA, below which, the trend will turn in favor of the bears.
LEARN HOW TO TRADE CRYPTOCURRENCY WITH A MASTER CRYPTO TRADER!
Hopefully, you have enjoyed today’s article. Thanks for reading!
Have a fantastic day!
Nisha Patel
Live from the Platinum Trading Floor.