The 1000€ Holding Challenge
This post belongs to The 1000€ HOLDING CHALLENGE, an experiment that consists of holding 1000€ in cryptos during the whole 2018. If you want to enroll or know more, here are some interesting posts:
- New to cryptos? Start here
- How to prepare the portfolio?
- How to buy cryptos?
- How to store cryptos?
- Weekly portfolio evolution?
Week 1 Evolution
It has been one week since I bought my coins for the holding challenge portfolio. Only seven days but the return is amazing. In this post you will find different plots with some explanations:
- Total portfolio evolution since the beginning (1 Jan).
- Coin evolution (in percent) during this week.
- Earnings of this week (in percent and in €).
So here we go. In this picture we have the evolution of the total portfolio value in each day of the week. Monday and Tuesday were amazing, with almost a 10% each day.

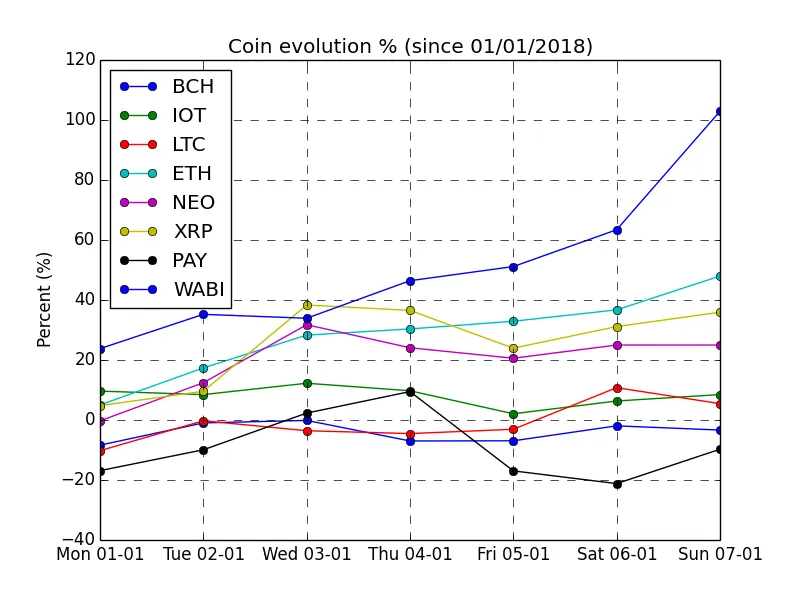
Now you can see the evolution of each coin during the week. WaBi and Ethereum were the best, with some losses in Bitcoin Cash and PayX. We will go after with some news that affected.
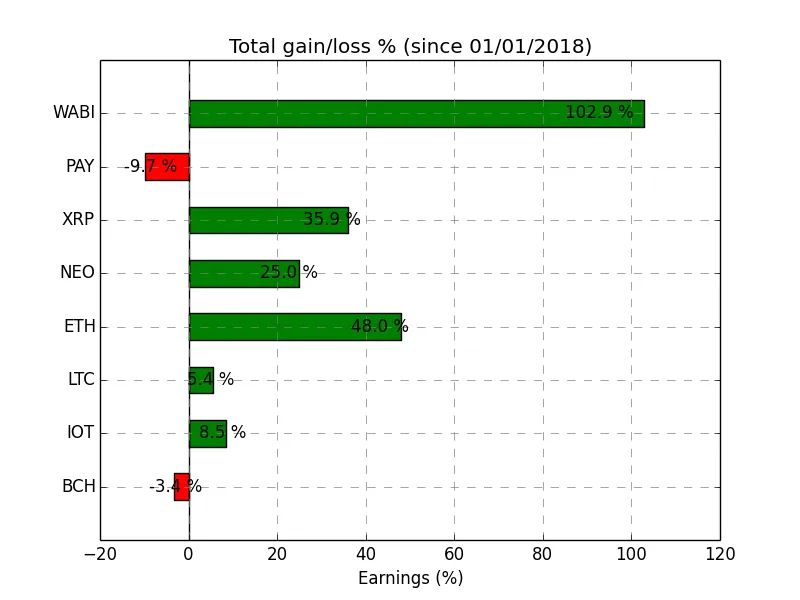
Here you have the close percent at the end of the week (Sunday 7th). Only two coins are in red, so not bad.
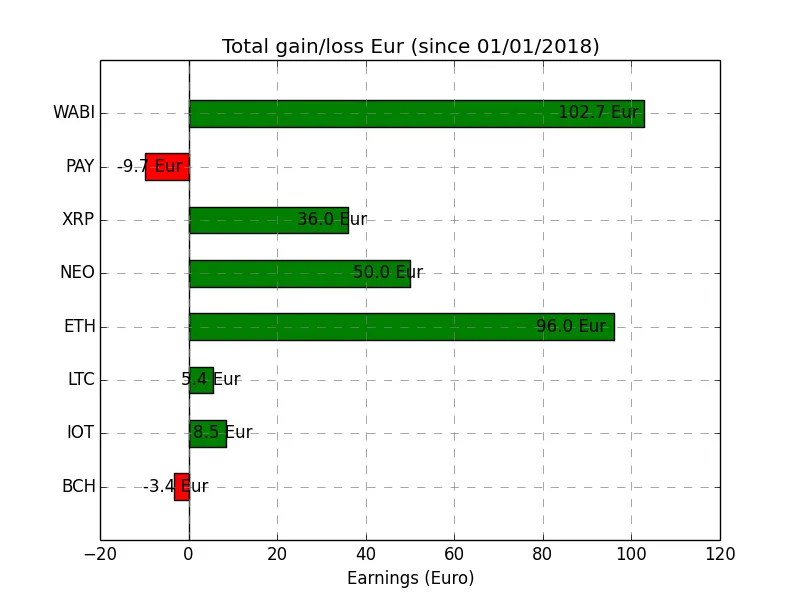
In the following plot you have basically the same, but instead of plotting the close percent, you can see the earnings that I had. Remember that I invested 100 € in each coin but 200 € in Ethereum and Neo.
And some interesting data you can infer form the graphs:
- Final value of portfolio 1285 € or +28.5 %
- Best coin is WaBi with +102 € gained or +102 %
- Worst coin is Pay with -9.7 € or -9.7 %
In the next posts I will add more graphs, to track the evolution from two points of view. The first, considering January 1st as reference and the second considering the previous week as reference. If you have any feedback or would like to know anything about the plots or how I made them, just drop a comment and I will be happy to help.
Cheers! And to the moon!