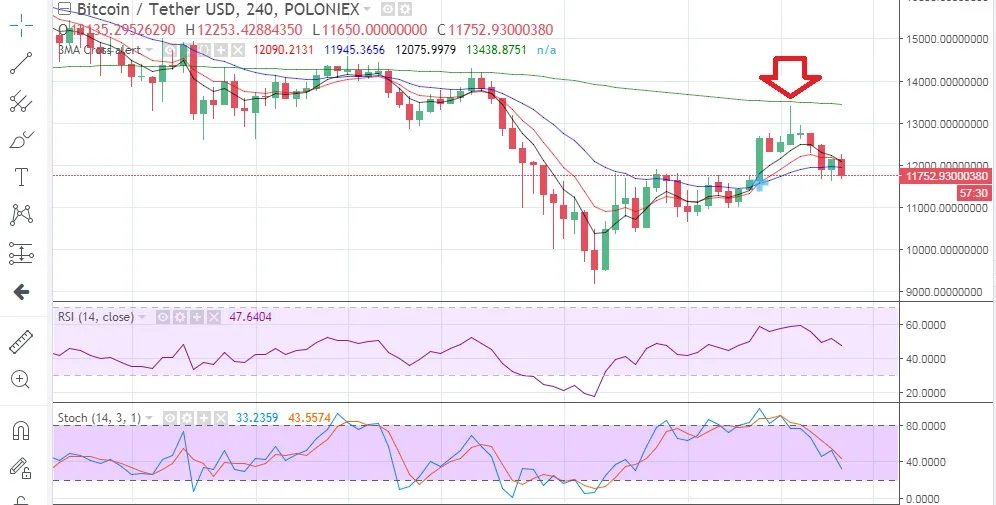
Dear friends and traders I want to share with you the graph with candles from 4 hours in tradingview of the pair Bitcoin Dollar, clearly showing that the price of the Bitcoin is approaching the resistance of the exponential line EMA 200, I think that this resistance is key to go r if the price bounces down to seek minimum prices again or otherwise moves into an uptrend again.
We maintain our position in Bitcoin and are aware of the events.