Summary
Pivot really just means "an area around which something is about". Within technical trading, pivot points refer to price levels that act as a kind of pivotal point. Daytraders use these points to define interesting levels on a price graph where you buy or sell. There are different methods for calculating pivot points, but the most common is calculated as follows:
Today's pivot point = (yesterday's highest rate + Yesterday's lowest price + closing price) / 3
Quite simply, many traders perceive this point as a kind of search point. This means that if today's price starts well below the pivot point, they are aiming for the price to go up against the point. However, if today's price begins far above the pivot point, then the price will look down to the point.
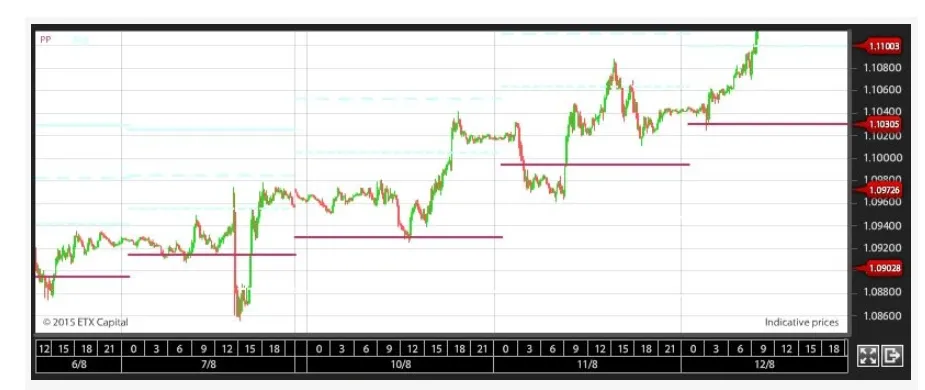
The price of euro against dollars with the entered pivot.
The figure shows today's pivot point the character as a black line in the EURUSD price. Notice how the price always crosses today's pivot point. If you had bought or sold EURUSD in the morning with a target at the pivot point, you would have won a great five days in a row. On August 10, the pivot point will act as a resistance point, but the price nevertheless just crosses the pivot line.
Although you can use this one main line to orient yourself in a graph, most pivot traders typically use several other lines. These lines act as resistance lines (support or resistance).
These lines are calculated as follows:
Resistance 1 = (2 x Pivot Point) - lowest rate (anniversary)
Support 1 = (2 x Pivot Point) - Highest Course (Yesterday's Day)
Resistance 2 = (Pivot Point - Support 1) + Resistance 1
Support 2 = Pivot Point - (Resistance 1 - Support 1)
Resistance 3 = (Pivot Point - Support 2) + Resistance 2
Support 3 = Pivot Point - (Resistance 2 - Support 2)
Most trading platforms have pivot points as the default tool, and there is therefore no reason to calculate all these points out even each morning.

Pivot with resistance- and support-areas.
In the figure, resistance 1 and 2 (R1 + R2) are drawn with short and long dotted lines, respectively. Support 1 and 2 (S1 + S2) are also drawn with short and long dashed lines. It is clear how these areas act as resistance areas for the price. The experienced pivot dealer will know when it's likely that the price either stops or runs through the resistance areas. Typically, you use pivot points on forex crossing, but the technique can also be used in other markets.