To all those that tell me I never shitpost, this one could be for you.......
I spend too much time looking at data and apparently, if you twist it the right way, it can turn into information. Sometimes that information can be interesting, and sometimes it will just piss you off.
I like engagement, I think it's a positive thing for the network. Two sets of data posts I do each week are based around engagement, one for utopian-io, and one for the people signed up to my Leagues. Before observing today's masterpieces, you should sign up to the Leagues, particularly if you like to make comments and reply to people when they like your 'nice post'.
The one chart
Brain-storming, coding, starting again, coding, analyzing, and presenting information - takes time you know. And sometimes, you can get to the end of a piece of work and think, that's totally useless, no-one is going to give a rats ass about that.
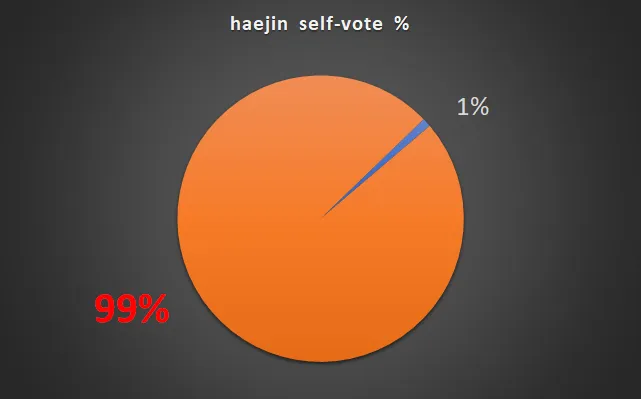
These charts though, absolute winners - breaking into new ground here I think. And the magical thing this analyst noticed, he just needed to change the title.
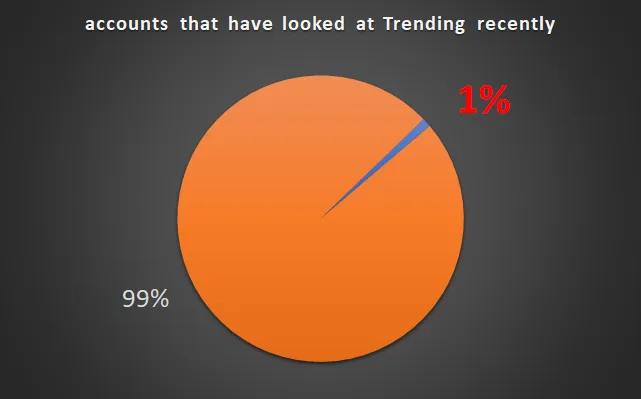
Generous?
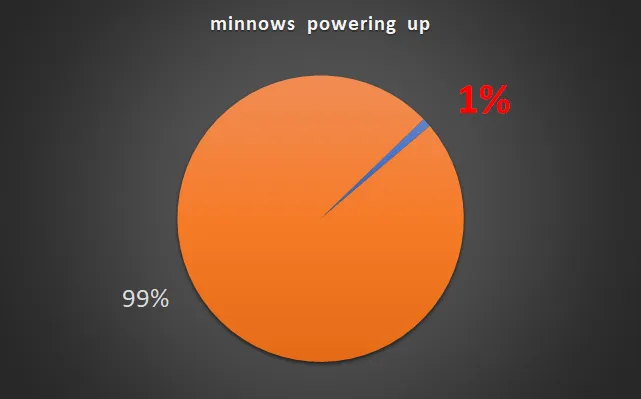
Join us, all 1500. (yes there are only 1500 dolphins)
Need more decimal places?
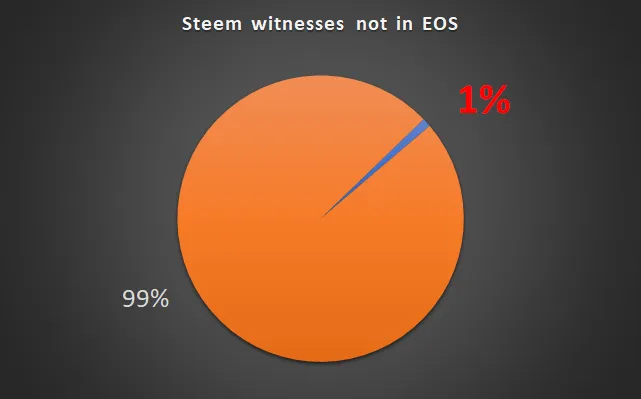
One foot on each ship
Summary
All this is not true. Well, it could be true but I didn't double-check.
Coat?... Got it.
Bye!
No dolphins or orcas were harmed in the production of this blog