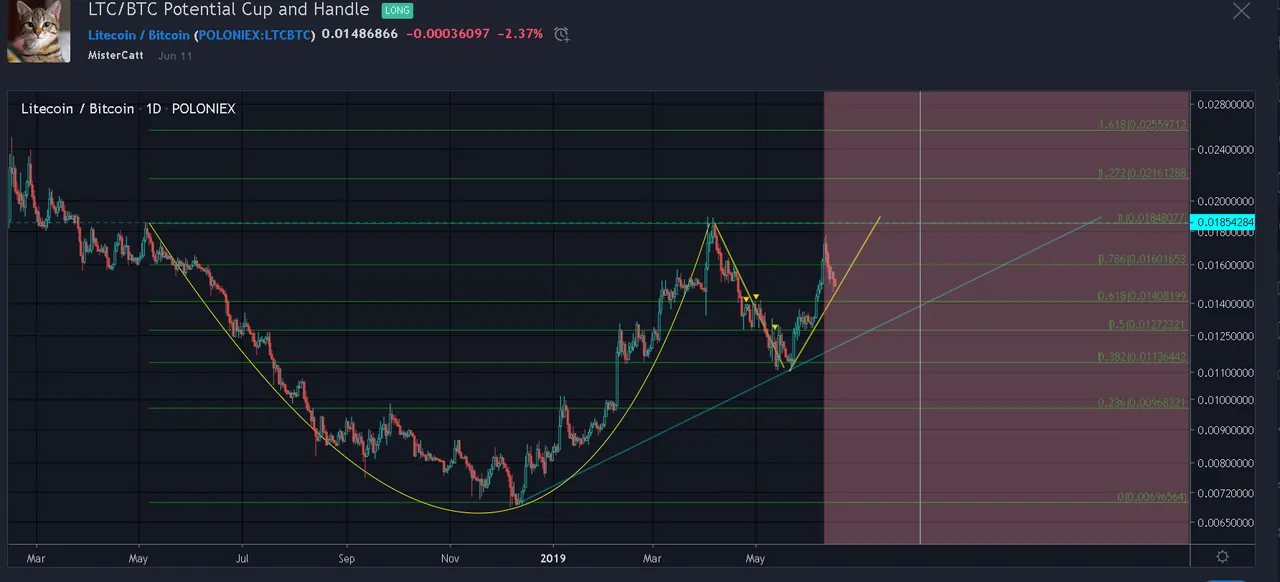
From my previous LTC/BTC that i made on June 11 2019.
--You can zoom in and out with ctrl+scroll middle mouse---
Looks like it had a retracement almost touch the top resistance on 0.0185 satoshi and retrace sharply toward latest trendline at present time.
Here's the chart for LTC/BTC on 1 day time frame for present time.
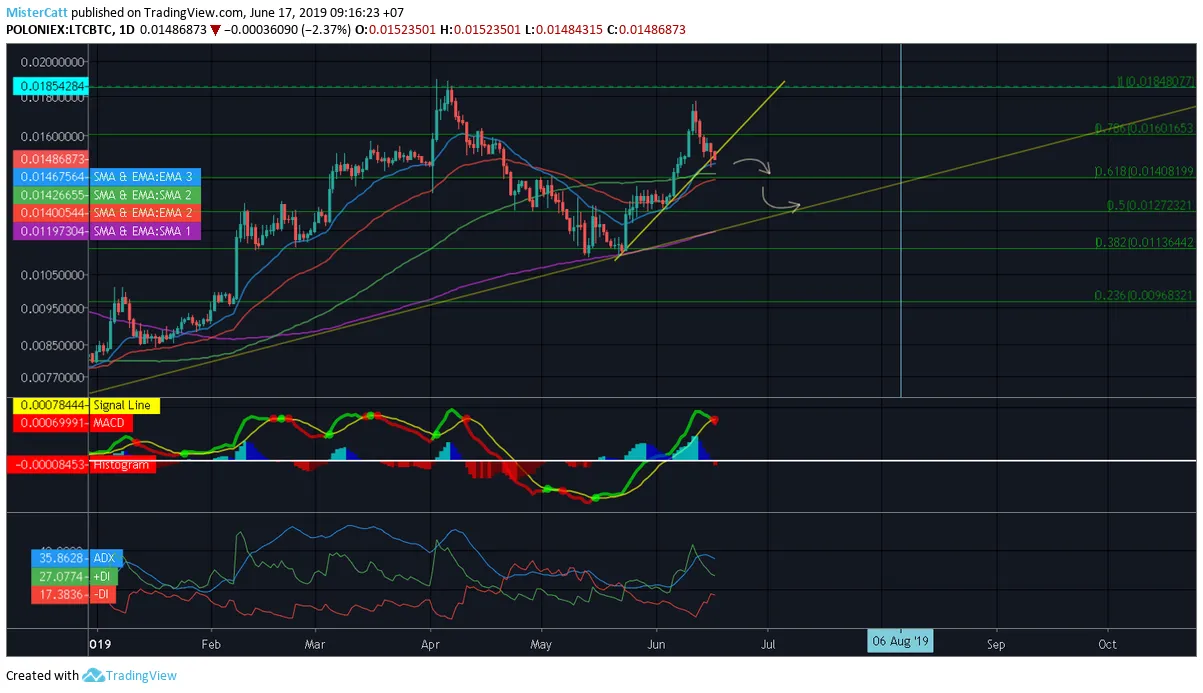
Indicators:
DMI, DI+(bullish strength) is getting closer with DI-(bearish strength) indicate a bullish momentum is began to weakening. ADX (momentum strength) is above 25 which quite good momentum for which ever momentum is supporting currently.
MACD, Macd line is already create a bearish signal indicate a switch of momentum is beginning, also notice a small seller histogram is already appear.
Key point:
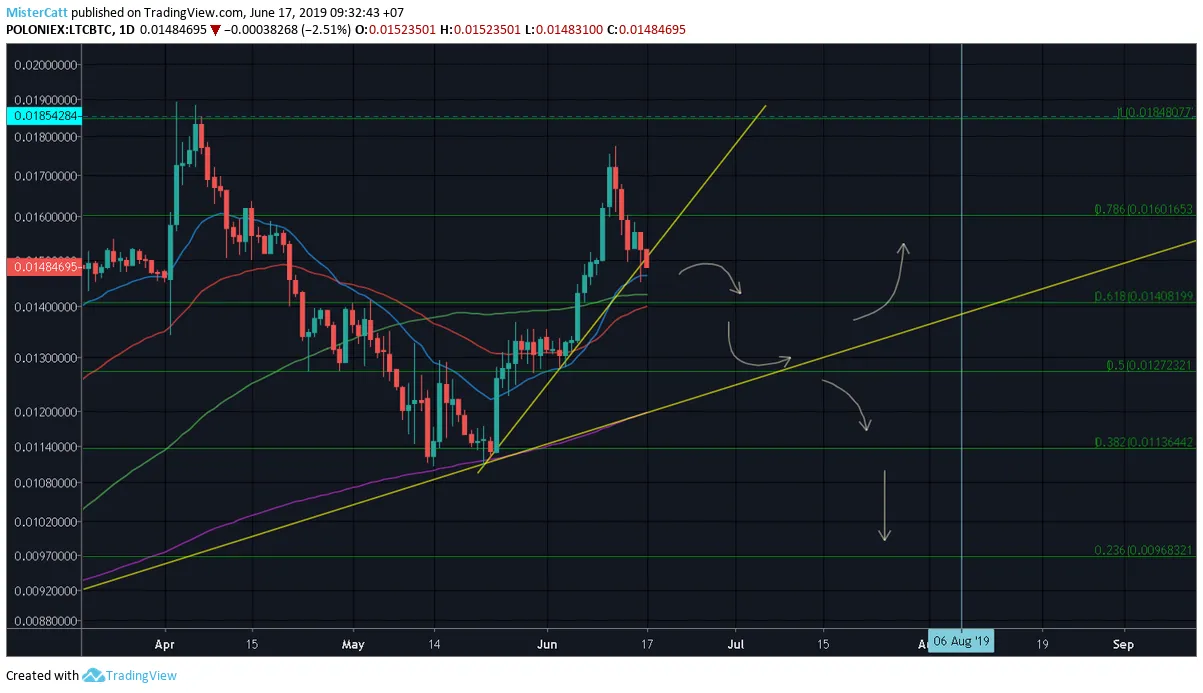
- Keep an eye for the fibonacci line, SMA and EMA line as it's could be a potential resistance and support in near future.
- In order to keep the bullish trend in tact for long term, these 2 up trend line must be hold (yellow line) for bullish trend to be maintaining.
- Each arrow sign is a possible scenario of movement price action if each line (trendline or fibonacci line) is broken.
- If the price action drop below these 2 trendline would be major pull back is potentially would happen or bearish for ltc/btc for quite a while.
- vertical line is a date when halvening of Litecoin would happen.
Thank you for your time to read this post and please take this idea as a grain of salt as reality always differ from what i expect as this post merely just an opinion and please feel free to share what your thought on comment section.
peace.