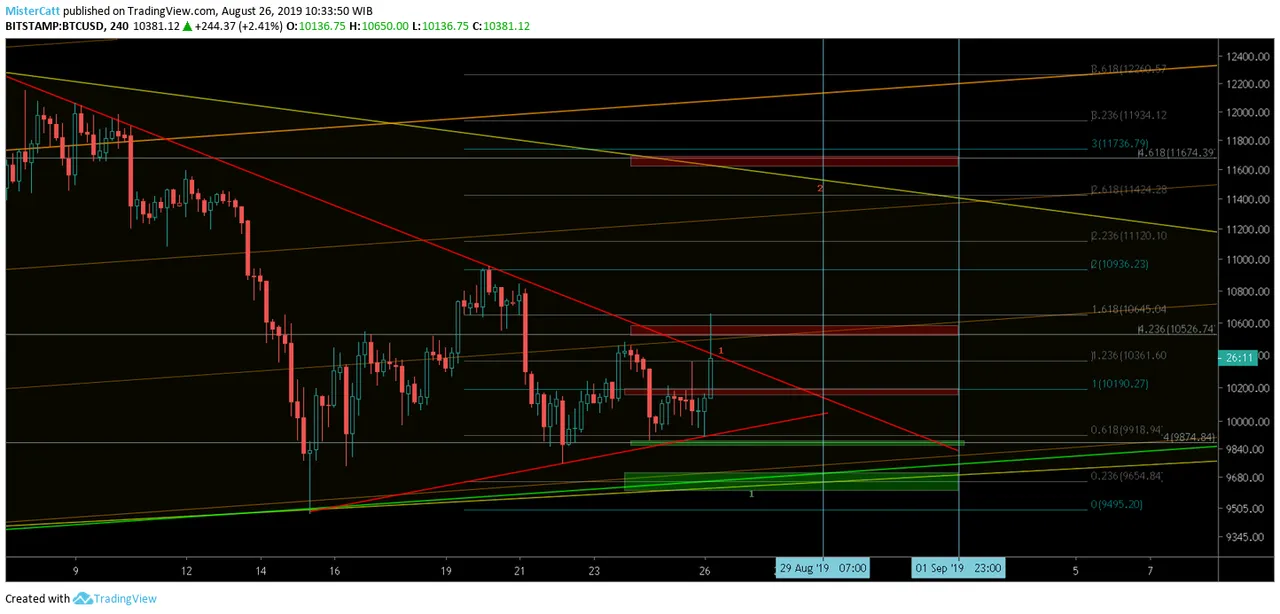
Short term ; Support : 10200 & 10000 || Resistance 10650 & 10945
BTCUSD pump a price a while above the down trendline (red) briefly while it's being rejected from 10600 to current level now 10400. maintain above these down trendline on 4 hour would be a bullish sign that could project the price to test 10600 - 11000.
It's possible the price action retest 10200 before it's continue the bullish trend.
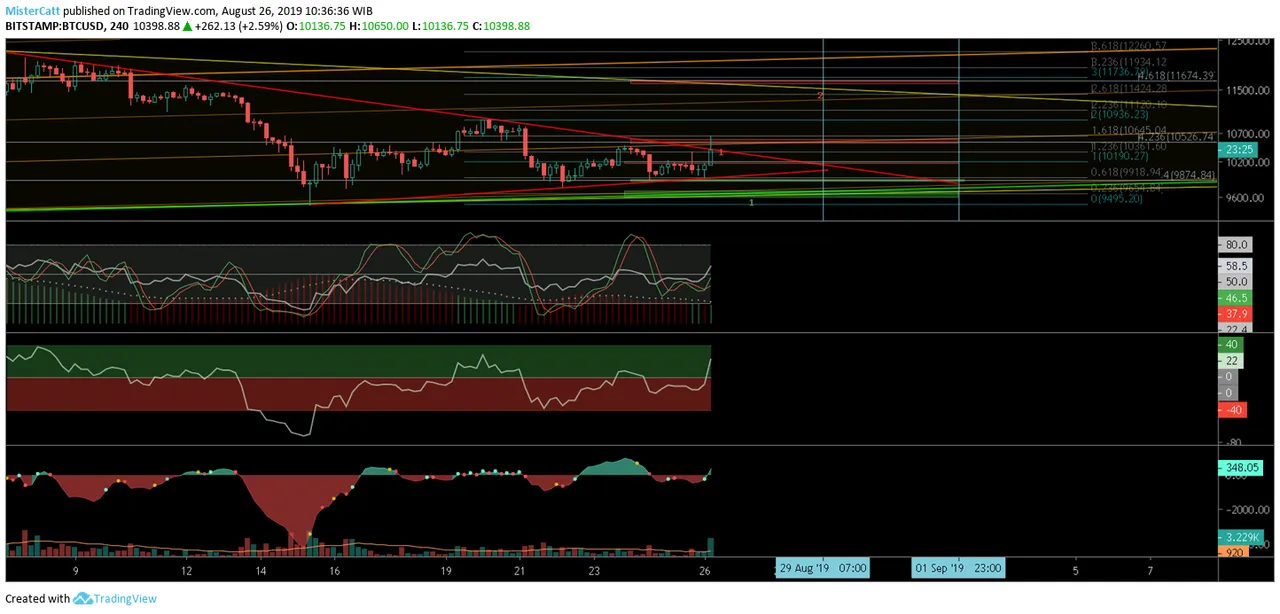
Momentum quickly turn into bullish trend after recent pump.
See Indicators on 4 hour ; |Stochastic RSI & RSI (1st indicator panel) is already cross above the neutral zone and stochastic RSI has a lot of room to grow.|
|CMF (2nd indicator panel) also spike above the neutral zone. it must stay above it for bullish trend to be confirmed.|
|OBV (3rd indicator panel) still looks weak in my opinion for now but it has a lot of room to grow in short future.|
Thank you for your time to read this post and please take this idea as a grain of salt as reality always differ from what i expect as this post merely just an opinion.
and please feel free to share what your thought on comment section.
peace.