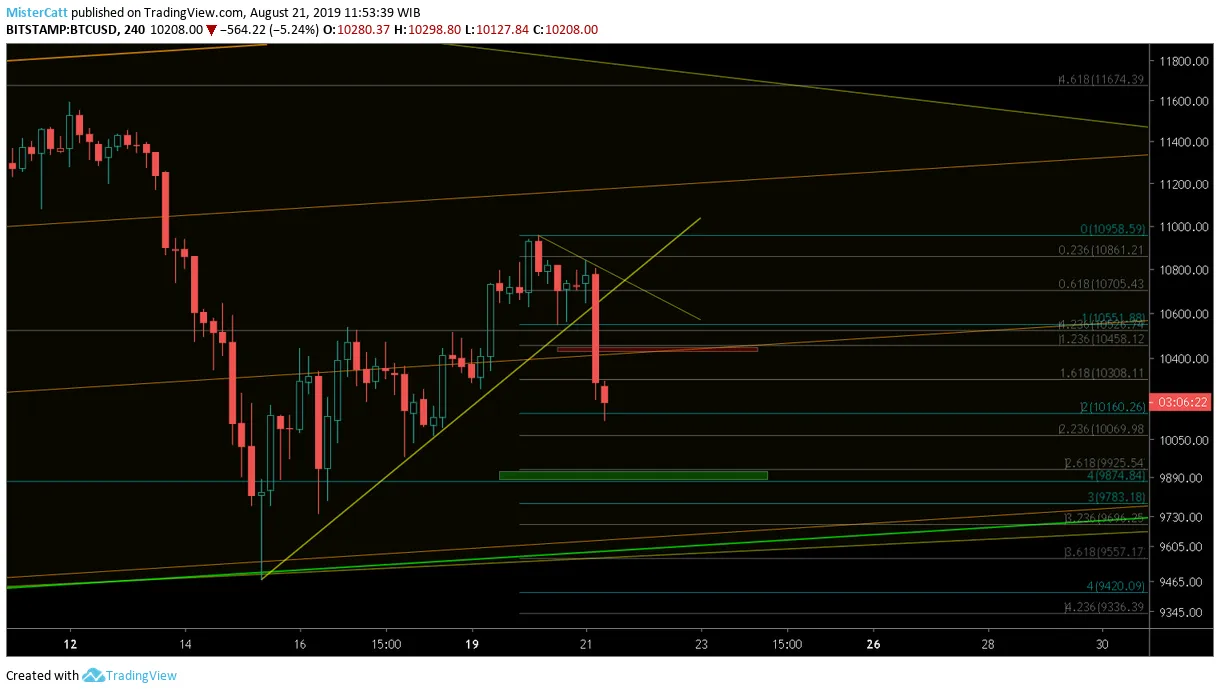
Short term ; Support : 10070 & 9900 || Resistance : 10350 & 10500
Finally BTCUSD giveup the support at 10500 and looks more likely the price action will meet around 10000 area as the next hard support more likely be encounter there.
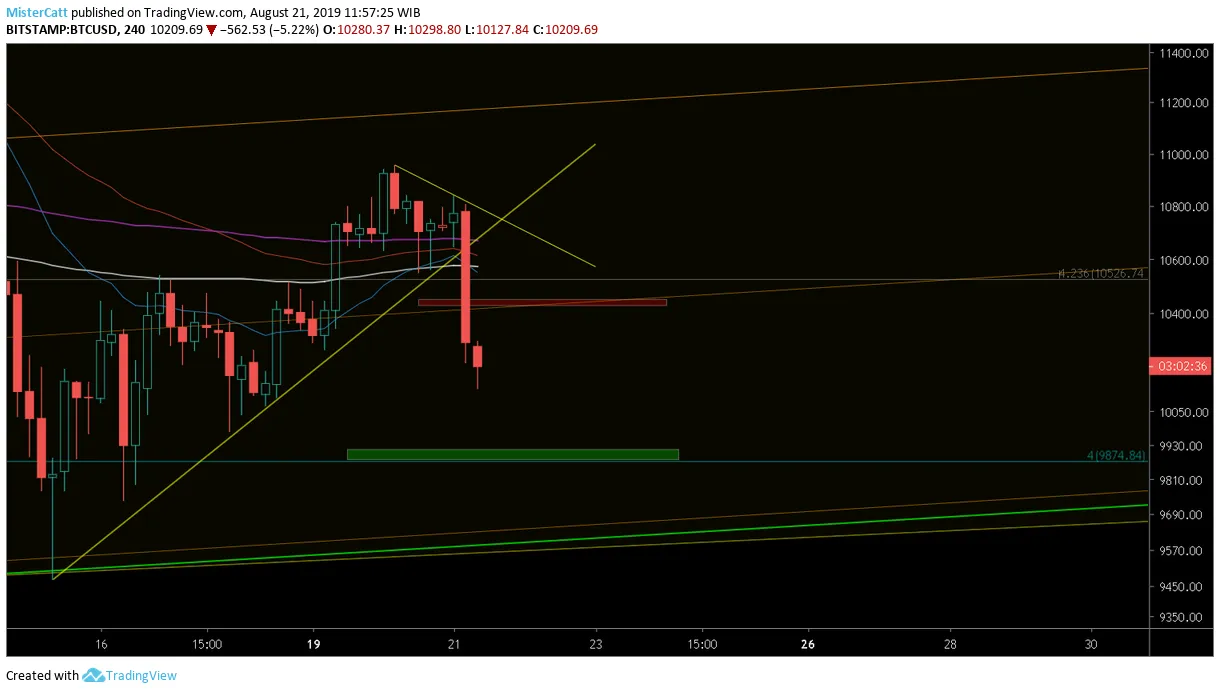
If BTCUSD decide to bounce from current level ( currently at 10190) i expect a hard resistance to pass through 10500 as Important moving averages stays on that level. ( 200 SMA and EMA, 21 & 51 EMA)
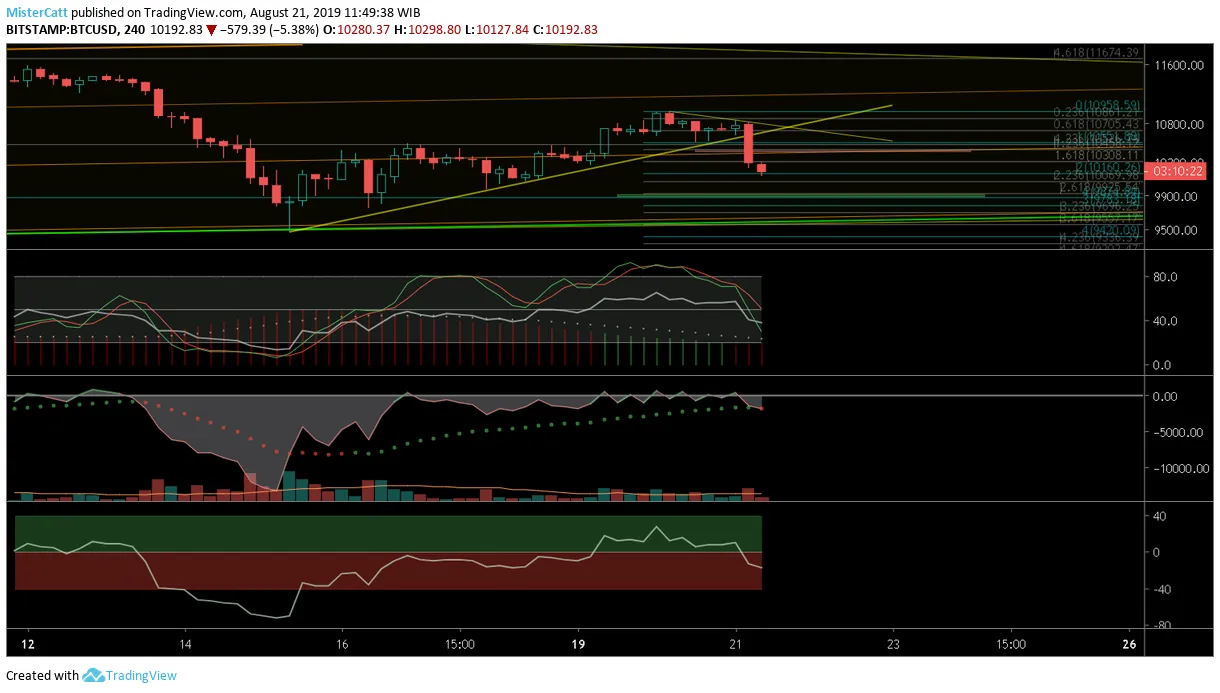
- Indicators at 4 hour indicators already broke the bullish structure after it couldnt maintain above the neutral zone/bullish zone (CMF, OBV, RSI &STOCH RSI). see the chart all of it turn below the middle white line (neutral zone) and pointing down.
Thank you for your time to read this post and please take this idea as a grain of salt as reality always differ from what i expect as this post merely just an opinion.
and please feel free to share what your thought on comment section.
peace.