
By: Daniel R. Munro M.B.A.
History has shown us that the most effective business survey questionnaires look professional and motivating to end-users, ask the right questions in the proper context, and provide measurable response variables by grouping them into logistical categories non-binary input. Yes or No/True or False simply doesn't make the cut anymore when it comes to gathering actionable insight about the user's perspectives, comprehension, and deriving non subjective opinions related to topics of inquiry. It is also important to articulate a distinct purpose behind the survey elements. People are becoming less and less willing to take the time out of their day to take online surveys unless the format is inviting and not intimidating and you are able to make answering the questions a clear and simple process. Finally, in terms of the viability of statistical data sets, the absolute minimum number of respondents is said to be 30 in order to make your population large enough to accurately quantify. So, while this may seem obvious, the bigger you data set, the more accurate your results will be. Luckily, we have the internet and many other ways in which surveys can be distributed and collected. It is imperative that you do whatever is necessary to make your surveys accessible to everyone within the given target population. As I mentioned before, many of the design principles applicable to self-administered paper questionnaires can be effectively applied to Web-based questionnaires. Surveymonkey.com is a great example of the online tools that can be used for developing comprehensive and distinct surveys, distinguishing specific parameters (Which we will discuss in greater detail later in this article), distributing them across channels, and gathering the results.
GREAT SURVEYS DRAW YOU IN BECAUSE THEY FOCUS ON IMPROVING YOUR PERSONAL EXPERIENCE.
THEY CONVERSELY TIE IN WITH YOUR INTERESTS, INQUIRE ABOUT YOUR DISINTERESTS, AND CONCLUDE WITH SOLUTIONS.
For example, the first question should be easy to answer, requiring no more than a few seconds of respondents’ time; the questions should progress in a logical fashion; questions relating to the same topic should be kept together; and bolding or italicizing can be used to direct participants’ attention to important words. In addition to these basic principles of good design, there are a number of important factors for Web survey designers to evaluate when constructing an online questionnaire.
Web surveys offer the opportunity to use a variety of exciting bells and whistles, including the ability to embed colorful images, video, and audio to enhance questionnaires. When it comes to designing Web-based questionnaires, however, simplicity is usually best (Dillman, 2000). Another study that I read discussed the psychological elements of survey respondents and illustrated some steps involved in the optimization of methodological research into reliability and validity of data resulting from attitude measurements is of substantial significance for others to build on in other language and cultural contexts, (Scherpenzeel and Saris, 1997).
Based on an emerging agreement among social psychologists, they define attitudes as “structures in long-term memory”. Their analysis of the cognitive process that is required to answer attitude questions is based on the assertion that a four-stage process is involved on the part of the respondent.
The four stages are assumed to be the following:
- Interpretation of the question (“What is the attitude about?”).
- Retrieval of relevant beliefs and feelings.
- Application of these beliefs and feelings to generate appropriate judgment.
- Use of this judgment to formulate response.
An understanding of this process is deemed necessary for the understanding of the reliability of respondents’ answers to attitudinal questions. Each of these stages is likely to be influenced by psychological variables that, in turn, may be recompensed with the data collection method (Fowler, 1995). According to the National EMSC Data Analysis Resource Center website some respondents can easily run into difficulties deciphering the meaning of a question that uses two negative words. For example, "Should the pizza restaurant not be responsible for not taking out the trash?"
The question is ambiguous; almost any answer will be even more so. You also want to avoid the use of too many abbreviations, acronyms, or jargon. By using technical terms in your survey you run the risk of lower response rates. It is also important not to ask objectionable or value-laden questions that may incline respondents answer emotionally, without regard for the context in which a given term is used.

If you ask people's attitudes toward a specific government social program and characterize it as "liberal" or "conservative," people are likely to react to their feelings about "liberal" or "conservative" and not about the program itself (http://www.nedarc.org). In extension to this, survey questionnaires must avoid asking leading questions that suggest an answer, because this could end up pushing a subtle bias on the respondents. Also, you don’t want to ask open-ended questions unless it is absolutely necessary. Including too many open-ended questions will seriously change your response rate.
Open-Ended Questions.
Answering open- ended questions requires more time and thought than selecting answers from a pre-existing list of alternatives. The responses to open ended questions are also more difficult to analyze. The last two faults or “don’ts” of survey questionnaires that I will mention are double-barreled questions, which contain two or more distinct questions, but allow only one answer resulting in either a non-response or a response that is hard to interpret. The final things that you want to avoid in writing surveys are hypothetical questions.
People usually have problems in answering questions that relate to circumstances they have not experienced. For example, asking people how they would feel about certain topics if they were living in a different culture with different values and norms is difficult to answer. In conclusion; keep it simple, concise, non-bias, and universally relevant to your strategically sampled respondents.
=> The Statistical Strategy
The Likert-Scale:
Over the years, numerous methods have been used to measure character and personality traits (Likert, 1932). The difficulty of measuring attitudes, character, and personality traits lies in the procedure for transferring these qualities into a quantitative measure for data analysis purposes. The recent popularity of qualitative research techniques has relieved some of the burden associated with the dilemma; however, many social scientists still rely on quantitative measures of attitudes, character and personality traits.
In response to the difficulty of measuring character and personality traits, Likert (1932) developed a procedure for measuring attitudinal scales. The original Likert scale used a series of questions with five response alternatives: strongly approve (1), approve (2), undecided (3), disapprove (4), and strongly disapprove (5). He combined the responses from the series of questions to create an attitudinal measurement scale. His data analysis was based on the composite score from the series of questions that represented the attitudinal scale. He did not analyze individual questions. While Likert used a five-point scale, other variations of his response alternatives are appropriate, including the deletion of the neutral response (Clason & Dormody, 1994).
Likert-Type Versus Likert Scales
Clason and Dormody (1994) described the difference between Likert-type items and Likert scales. They identified Likert-type items as single questions that use some aspect of the original Likert response alternatives. While multiple questions may be used in a research instrument, there is no attempt by the researcher to combine the responses from the items into a composite scale. Table 1 provides an example of five Likert-type questions.
Five Likert-Type Answers for quantitative analysis:
Strongly Disagree Disagree Neutral Agree Strongly Agree
*****Dig Even Deeper Into Your Survey Statistics:
Nominal-Scales:
Referred to as the Steven's Scale of Measurement (Ary, Jacobs, & Sorenson, 2010). This input analysis technique consists of four categories: nominal, ordinal, interval, and ratio.
In the nominal scale, observations are assigned to categories based on equivalence. Numbers associated with the categories serve only as labels. Examples of nominal scale data include gender, eye color, and race.
Ordinal scale observations are ranked in some measure of magnitude. Numbers assigned to groups express a "greater than" relationship; however, how much greater is not implied. The numbers only indicate the order. Examples of ordinal scale measures include letter grades, rankings, and achievement (low, medium, high).
Interval scale data also use numbers to indicate order and reflect a meaningful relative distance between points on the scale. Interval scales do not have an absolute zero. An example of an interval scale is the IQ standardized test.
A ratio scale also uses numbers to indicate order and reflects a meaningful relative distance between points on the scale. A ratio scale does have an absolute zero. Examples of ratio measures include age and years of experience.
Survey Factor Analysis At the Highest-Levels:
The Hedonic Model Takes You Even Deeper....
9-Point Hedonic Scale
- Like Extremely
- Like Very Much
- Like Moderately
- Like Slightly
- Neither Like nor Dislike
- Dislike Slightly
- Dislike Moderately
- Dislike Very Much
- Dislike Extremely
Table 1.
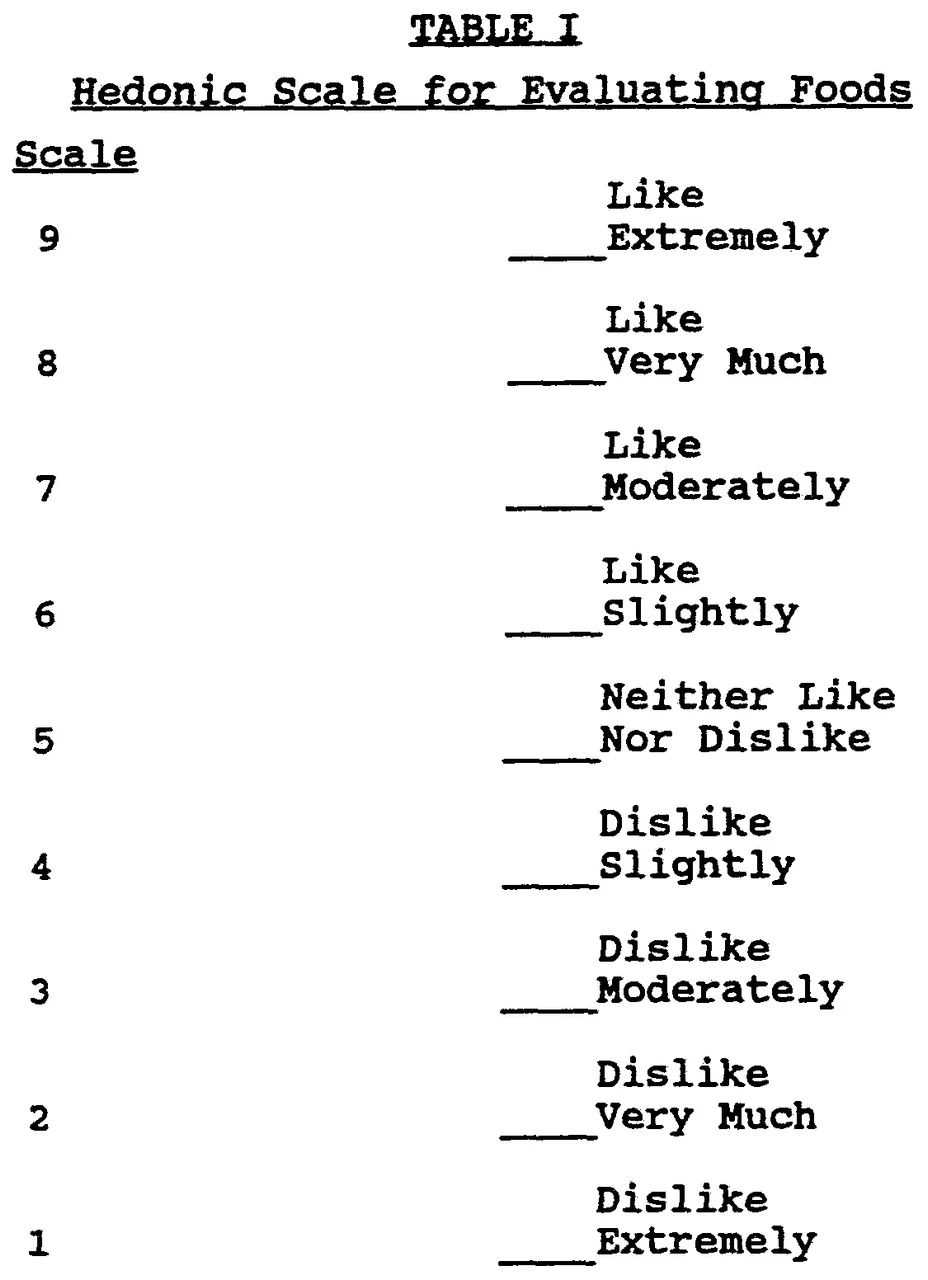
Anchoring of the 9 point hedonic scale:
Table 2.

For those with a background in Statistics, the Hedonic scale is able to provide much Higher accuracy due to the following: E(f)x=N(E)x
Hedonic Overview:
The hedonic scale was the result of extensive research conducted at the Quartermaster and the University of Chicago. Jones, Peryam & Thurstone back in 1955. Their findings showed that longer scales, up to nine intervals, tended to be more discriminating than shorter scales, and there was some indication that a scale with eleven intervals would be even more effective. The nine-point version became the standard at the Quartermaster, because it fit better on the typing paper used to print the ballots.
The verbal anchors of the scale were selected so that the psychological distance between successive scale points is approximately equal2. This equal-interval property helps justify the practice of analyzing the responses by assigning successive integer values (1, 2, 3, … up to 9) to the scale points and testing differences in average acceptability using parametric statistics. The reliability, validity and discriminative ability of the scale was proven in food acceptance tests with soldiers in the field and in the laboratory, as well as in large-scale food preference surveys.
There have been several extensions of the 9-point hedonic scale. 4 showed that a scale with nine “child friendly” verbal anchors ranging from “super good” to “super bad” performed better with 5-10 year old children than either the original 9-point scale or a scale utilizing “smiley” faces. The original nine 9-point scale has also been translated into several foreign languages (5 so far). It should be noted that the properties of the original 9-point scale do not necessarily apply to the translations of the scale. Ideally, research similar to that conducted by Peryam and colleagues should be conducted to select the verbal anchors and to confirm the reliability, validity, and discriminative ability of the proposed scale. At minimum, it is recommended that research be conducted to confirm that the rank order of the verbal anchors is unambiguous among the intended test population.
Stay Up on Business Strategy and Expert Survey Development
Visit The BOVI Consultancy Services Website at:
https://www.bovipros.com/

Web Sources:
- https://www.joe.org/joe/2012april/tt2.php
- http://www.sensorysociety.org/knowledge/sspwiki/Pages/The%209-point%20Hedonic%20Scale.aspx
- http://www.sagepub.com/sites/default/files/upm-binaries/14496_Chapter5.pdf (Links to an external site.)
- http://onlinepubs.trb.org/onlinepubs/circulars/ec008/workshop_h.pdf (Links to an external site.)
- http://www.nedarc.org/media/pdf/survey_survey_design.pdf (Links to an external site.)
References:
1 Peryam, D.R. and Girardot, N.F. 1952. Advanced taste test method. Food Engineering, 24, 58-61, 194.
2 Jones, L.V., Peryam, D.R., and Thurstone, L.L. 1955. Development of a scale for measuring soldiers’ food preferences. Food Research, 20, 512-520.
3 Peryam, D.R. and Pilgrim, F.J. 1957. Hedonic scale method of measuring food preferences. Food Technology (September 1957), 9-14.
4 Kroll, B.J. 1990. Evaluating rating scales for sensory testing with children. Food Technology, 44(11), 78-80, 82, 84, 86.
5 Munoz, A.M. and King, S.C. (eds.) 2007. International consumer product testing across cultures and countries. ASTM International, MNL 55.
"hedonic scale." A Dictionary of Food and Nutrition. . Retrieved October 10, 2017 from Encyclopedia.com: http://www.encyclopedia.com/education/dictionaries-thesauruses-pictures-and-press-releases/hedonic-scale
Allen, K., Varner, K., & Sallee, J. (2011). Addressing nature deficit disorder through primitive camping experiences. Journal of Extension [On-line], 49(3) Article 3IAW2. Available at: http://www.joe.org/joe/2011june/iw2.php
Ary, D., Jacobs, L. C., & Sorensen, C. (2010). Introduction to research in education (8th ed.). California: Thomson Wadsworth.
Beaudreault, A. R., & Miller, L. E. (2011). Need for methamphetamine programming in Extension education. Journal of Extension [On-line], 49(3) Article 3RIB6. Available at: http://www.joe.org/joe/2011june/rb6.php
Behnke, A. O., & Kelly, C. (2011). Creating programs to help Latino youth thrive at school: The influence of Latino parent involvement programs. Journal of Extension [On-line], 49(1) Article 1FEA7. Available at: http://www.joe.org/joe/2011february/a7.php
Clason, D. L., & Dormody, T. J. (1994) Analyzing data measured by individual Likert-type items. Journal of Agricultural Education, 35(4), 31- 35.
Diker, A., Walters, L. M., Cunningham-Sabo, L., & Baker, S. S. (2011). Factors influencing adoption and implementation of cooking with kids, An experiential school-based nutrition education curriculum. Journal of Extension [On-line], 49(1) Article 1FEA6. Available at: http://www.joe.org/joe/2011february/a6.php
Elizer, A. H. (2011). Are transformational directors required for satisfied agents? Journal of Extension [On-line], 49(2) Article 2RIB1. Available at: http://www.joe.org/joe/2011april/rb1.php
Elizer, A. H. (2011). Are transformational directors required for satisfied agents? Journal of Extension [On-line], 49(2) Article 2RIB1. Available at: http://www.joe.org/joe/2011april/rb1.php
Hines, S. L., Hansen, L., & Falen, C. (2011). So, you want to move out?!—An awareness program of the real costs of moving away from home. Journal of Extension [On-line], 49(1) Article 1IAW2. Available at http://www.joe.org/joe/2011february/iw2.php
Kalambokidia, L. (2011). Spreading the word about Extension's public value. Journal of Extension [On-line], 49(2), Article 2FEA1. Available at: http://www.joe.org/joe/2011april/a1.php
Kroth, M., & Peutz, J. (2011). Workplace issues in extension - A Delphi study of Extension educators. Journal of Extension [On-line], 49(1), Article 1RIB1. Available at: http://www.joe.org/joe/2011february/rb1.php
Likert, R. (1932). A technique for the measurement of attitudes. Archives of Psychology, 22(140), 1-55.
Robinson, P., & Shepard, R. (2011). Outreach, applied research, and management needs for Wisconsin's great lakes freshwater estuaries: A Cooperative Extension needs assessment model. Journal of Extension [On-line], 49(1), Article 1FEA3. Available at: http://www.joe.org/joe/2011february/a3.php
Singletary, L., Emm, S., & Hill, G. (2011). An assessment of Agriculture and Natural Resource Extension programs on American Indian reservations in Idaho, Nevada, Oregon, and Washington. Journal of Extension [On-line], 49(2), Article 2FEA2. Available at: http://www.joe.org/joe/2011april/a2.php
Walker, E. L., Vaught, C. R., Walker, W. D., & Nusz, S. R. (2011). Attitudinal survey of producers involved in a meat goat artificial insemination clinic. Journal of Extension [On-line], 49(2), Article 2FEA6. Available at: http://www.joe.org/joe/2011april/a6.php
Wyman, M., Escobedo, F., Varela, S., Asuaje, C., Mayer, H., Swisher, N., & Hermansen-Baez. (2011). Analyzing the natural resource Extension needs of Spanish-speakers: A perspective from Florida. Journal of Extension [On-line], 49(2), Article 2FEA3. Available at: http://www.joe.org/joe/2011april/a3.php
Floyd J. Fowler. Improving survey questions: design and evaluation. Applied Social Research Methods Series, Vol. 38. Sage Publications, Thousand Oaks, Calif., 1995.
Cooper-Schindler, 2014