Hi everyone and please welcome to our monthly stats. This is our March edition on the monthly stats.
March has been a very turbulent period for the Steem blockchain with a HardFork that created a new chain Hive. This has affected many things and the Steem Engine tribes are affected as well. Here we will look into the numbers.

We will be looking at the number of tokens issued, top earners, staking, activity on the web, prices etc.
The following topics will be covered:
- Tokens distribution (Issued Build tokens),
- Top Earners for the month
- Staking and top Stakers
- Share of tokens staked
- Number of users
- Posts and comments activities on the platform
- Posting from build-it.io interface,
- Price Chart
Issued BUILD Tokens
Let’s take a look into token distribution, inflation and how it is distributed.
Below is a chart that represents the cumulative issued BUILD token.
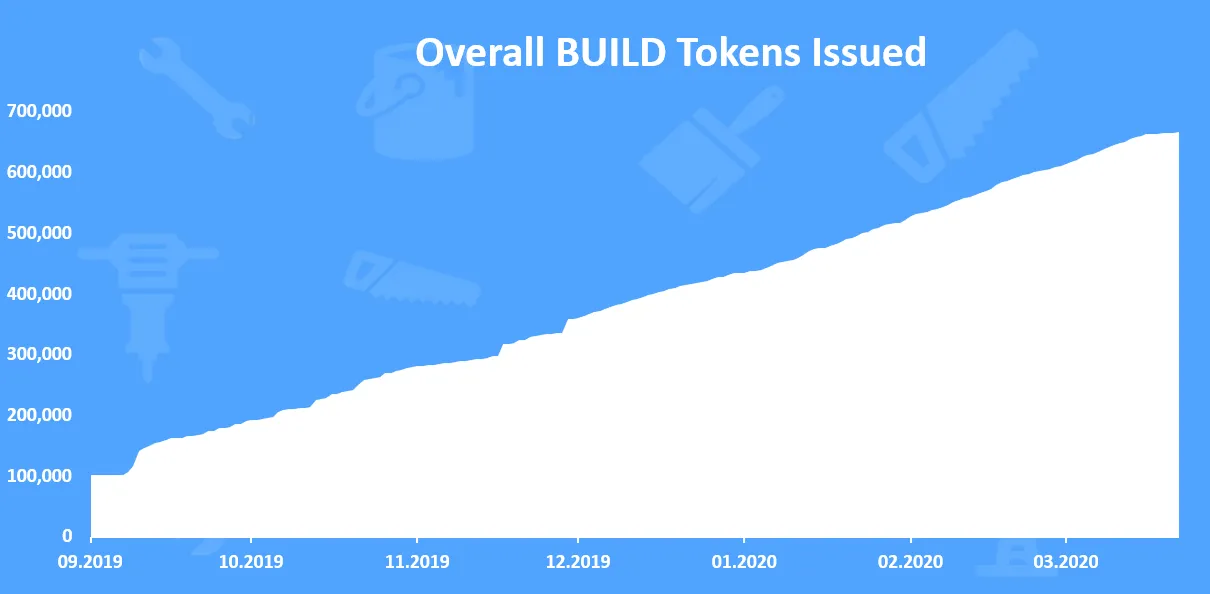
A total of 666k BUILD tokens issued till March 2020.
The number of tokens started with 100k and then growth over time.
Now let’s see the daily issued tokens for March 2020.
Here is the chart.
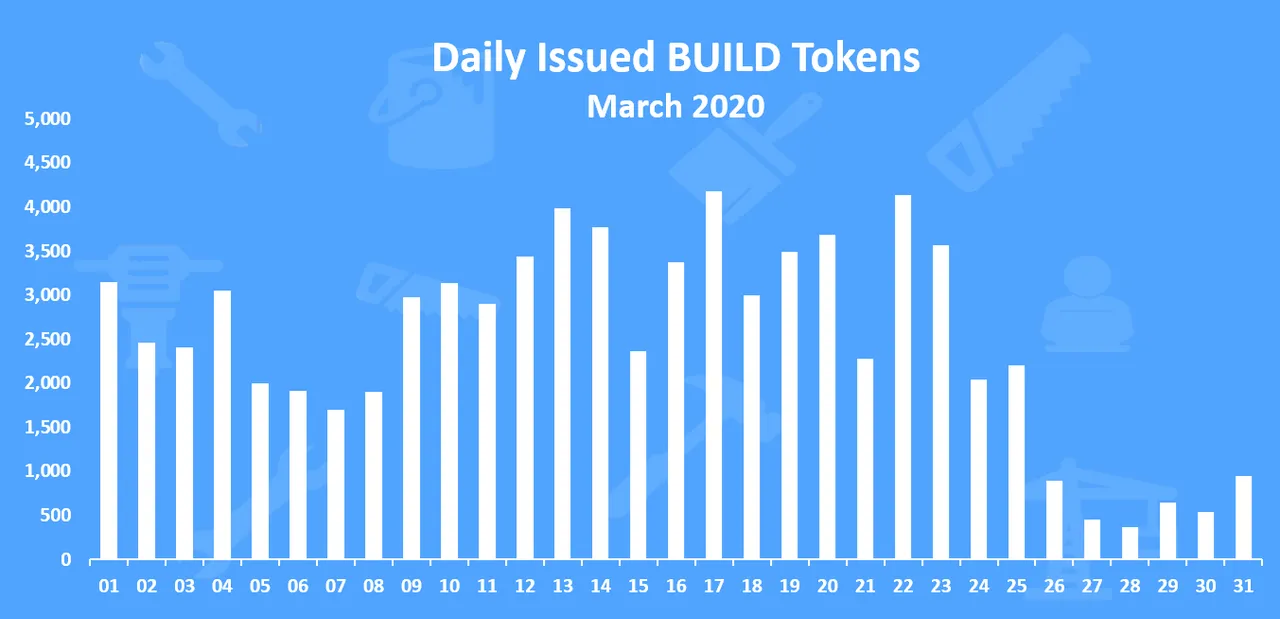
On average there is around 2500 BUILD tokens issued daily. In March 2020 the total amount of issued BUILD tokens is 76,808 tokens. We can notice the sharp drop on the end od the month and this is due to the HardFork and Steem Engine issues.
Top 10 BUILD Earners for the period
Now that we saw how the numbers on the tokens are issued let’s see how those are being distributed. How much do the top 10 received and how much the rest? How many accounts earned BUILD tokens?
Here is the chart of the Top 10 BUILD earners in the period.
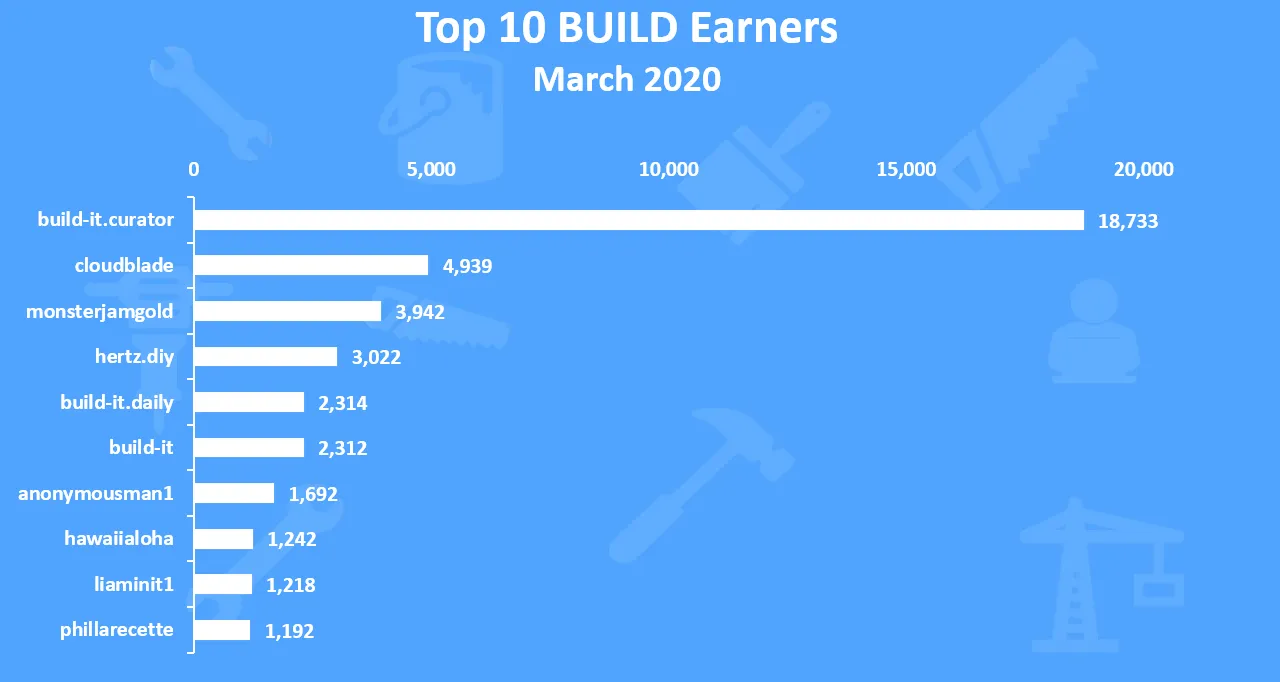
On the top is the build official account @build.it curator with 18k tokens, followed by @cloudblade with 5k tokens and @monsterjamgold with 4k tokens.
Staked Tokens
Staking is an important part of the tokenomics as it shows how much of the tokens are out of the market and put in use.
Below is the chart with overall BUILD staked tokens.
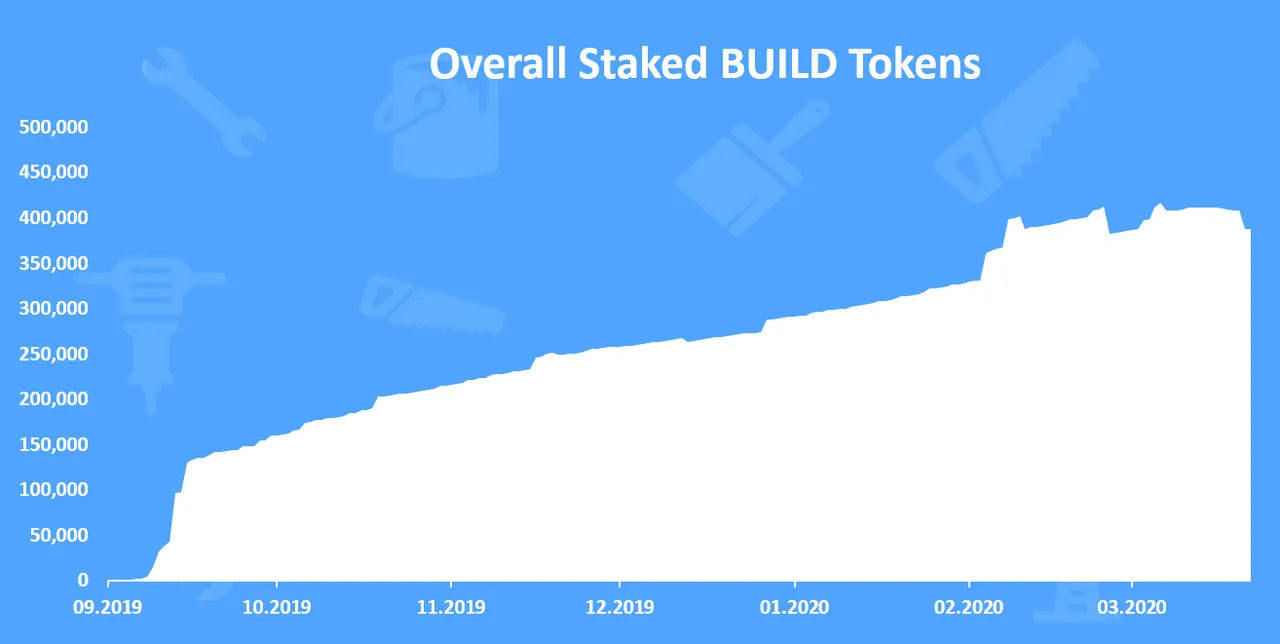
The staking started in September and it continue to grow since then.
But we can notice that in the previous month there is some unstaking happening as well mainly due to the HardFork.
Now the daily staking for the last month.
Here is the chart of the net staked tokens for the month.
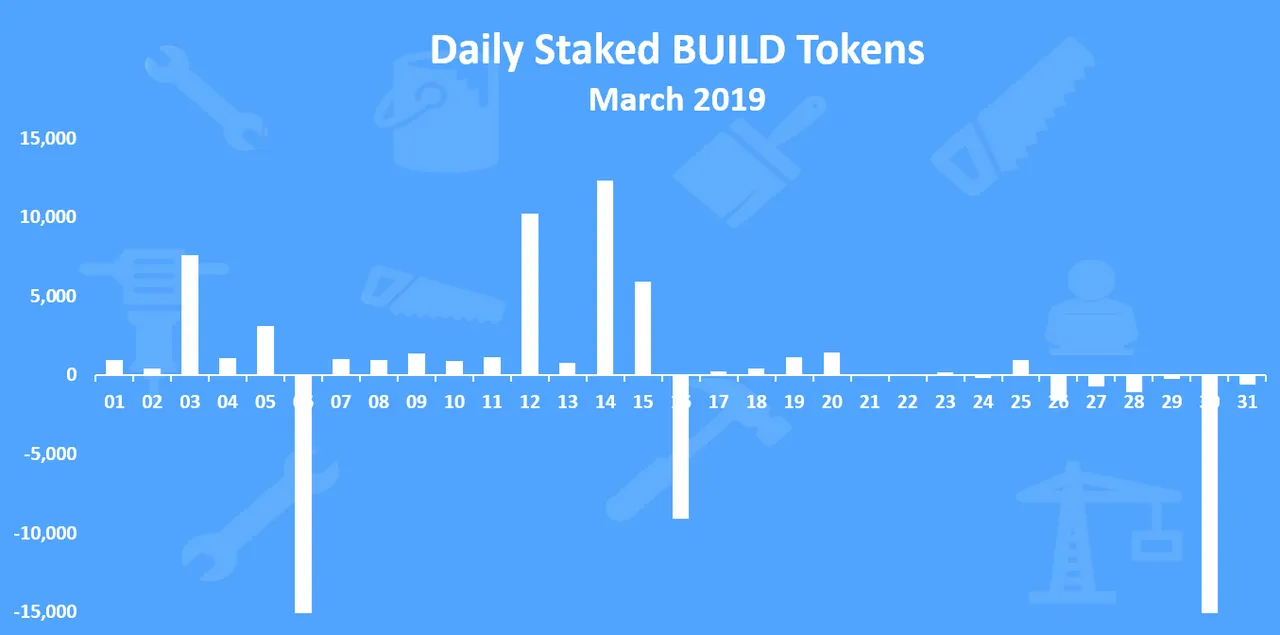
From the chart above we can see that there are days where a big amounts of BUILD tokens were unstaked. The HardFork had a big effect.
Top 10 BUILD Stakers in the period
Who is doing the staking? Here is the chart of the Top 10 BUILD stakers in the period analyzed.
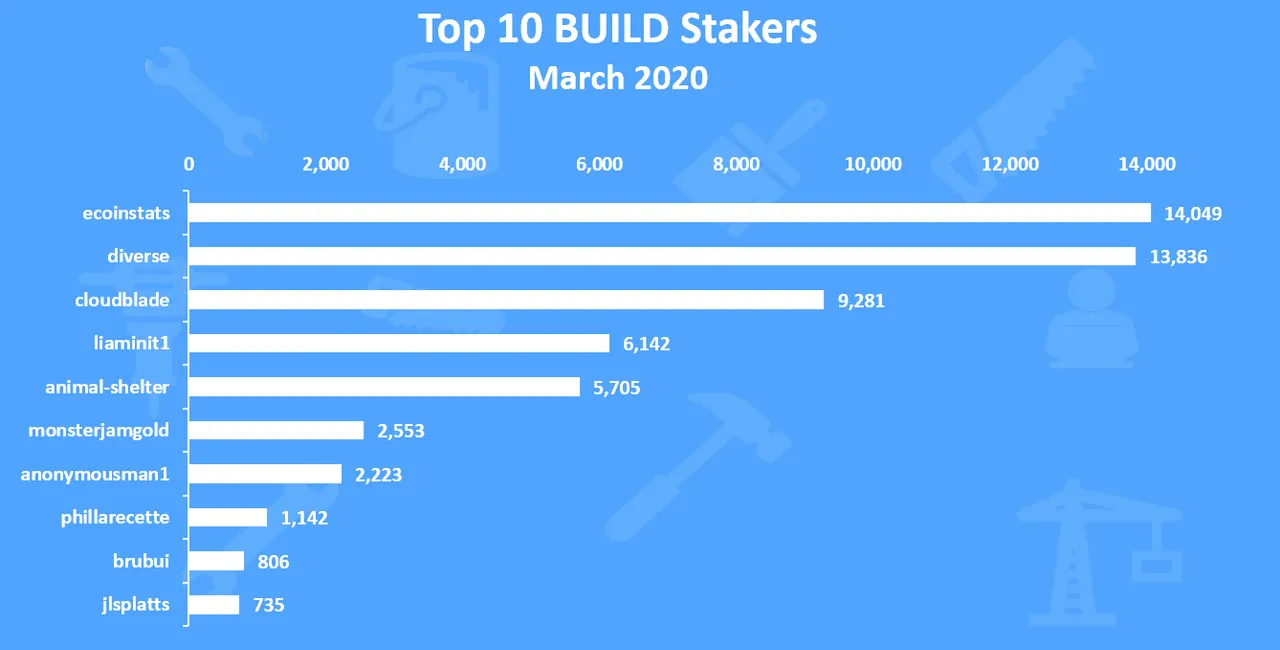
On the top is the build official account @ecoinstats with almost 14k tokens staked, followed by @diverse with 13k and @cloudblade on the third place.
Share of Tokens Staked
Below is a chart of the ratio staked/unstaked BUILD tokens.
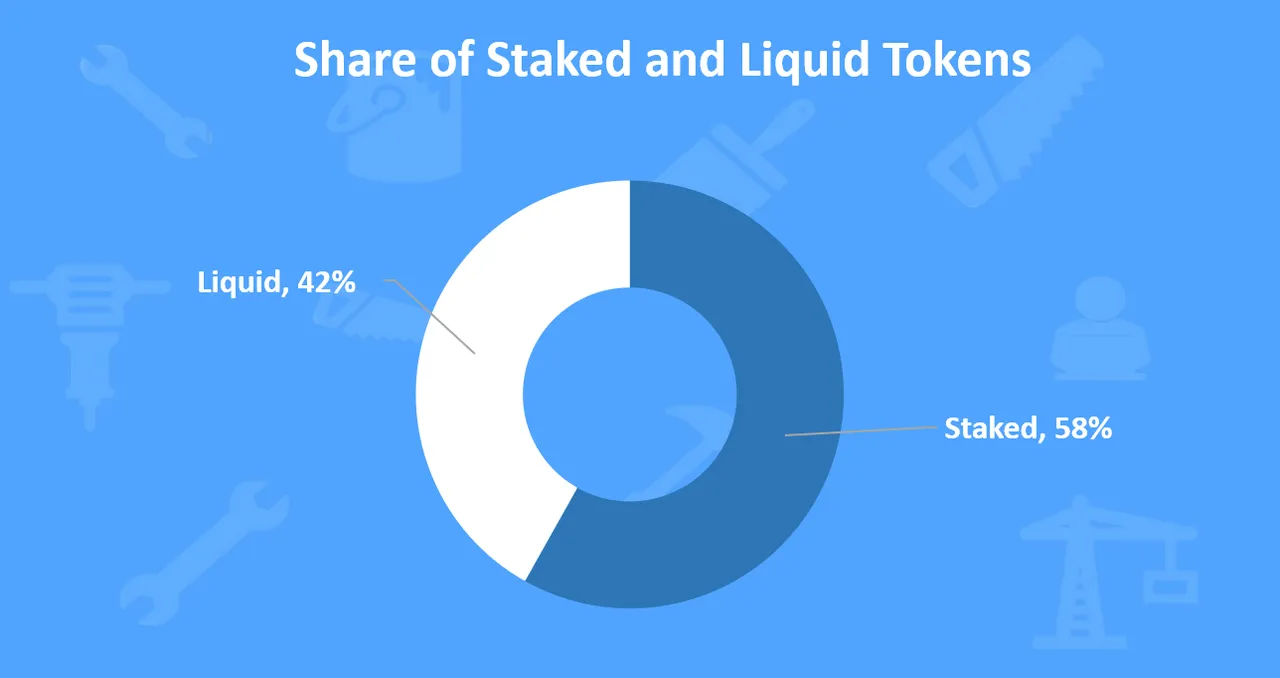
The share of the staked tokens is 58% and it has dropped from the 64% in the previous month.
Out of the current supply 666k tokens, around 387k are staked, and 278k are liquid at the end of March 2020.
BUILD Users
How is the BUILD community doing with the number of users?
Below is a chart with the number of unique users that posted on the Build-it web. These are users that posted directly from the web.
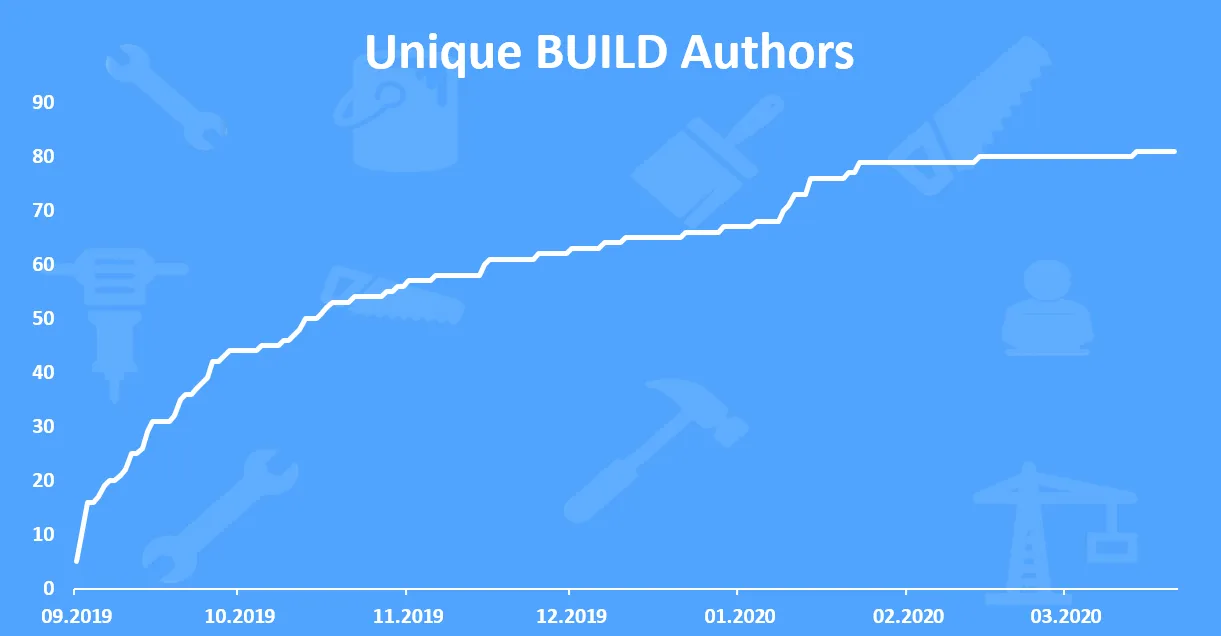
A total of 81 unique user have posted from the Build-it frontend.
The users who posted from other frontends and included the tag #build-it are not included in the chart above.
Build it now has its own community as well:
Activities on Build-it
Below is a char of the activities on Build-it, including posting and commenting from the Build-it interface and posting and commenting with the #build-it tag.
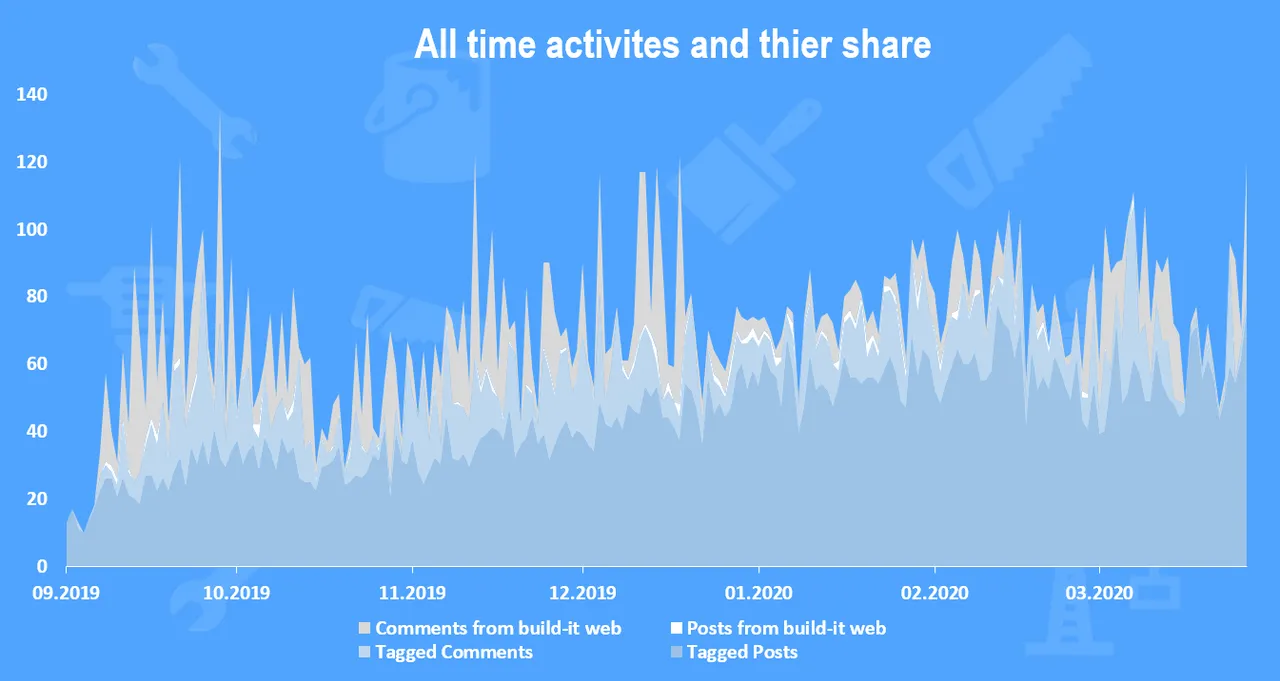
We can see that the majority of the posting still comes from other interfaces with the tag #build-it. Interesting to see that there is a lot of commenting on the build-it frontend.
Here is the chart only for posts from build-it interface.
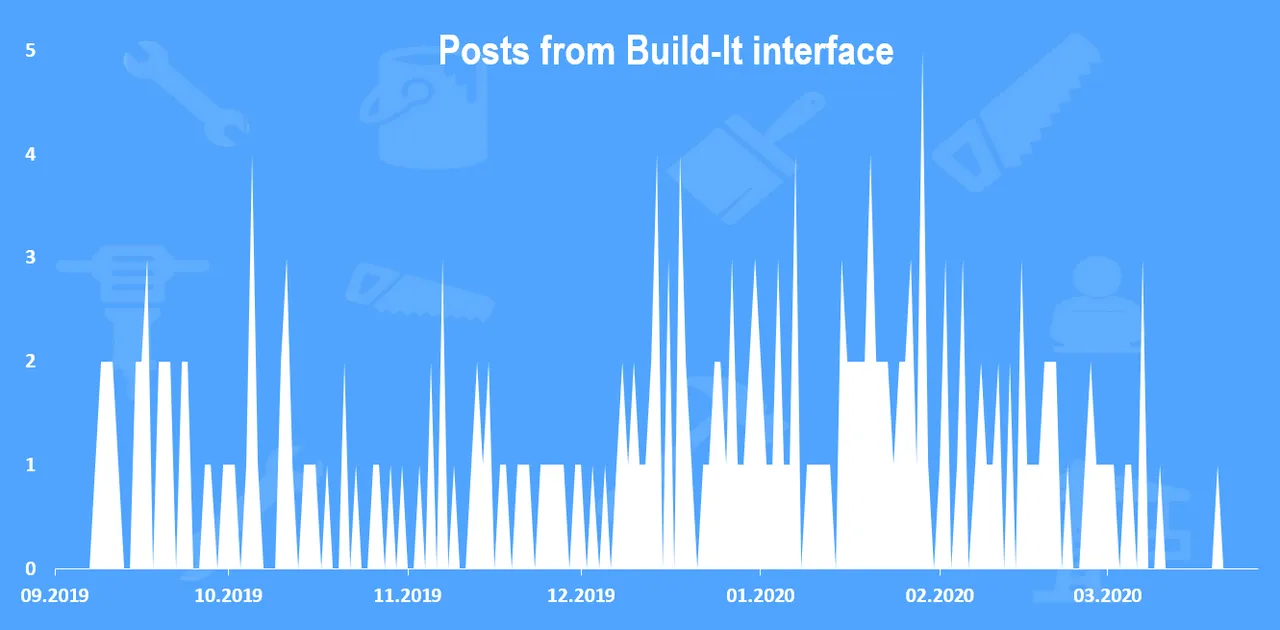
There is still not as much of posting from the frontend, but as mentioned the number of comments is doing much better.
Posts and comments from the Build-it interface
Below is the chart on the posts and comments from the Build-it web, in the period.
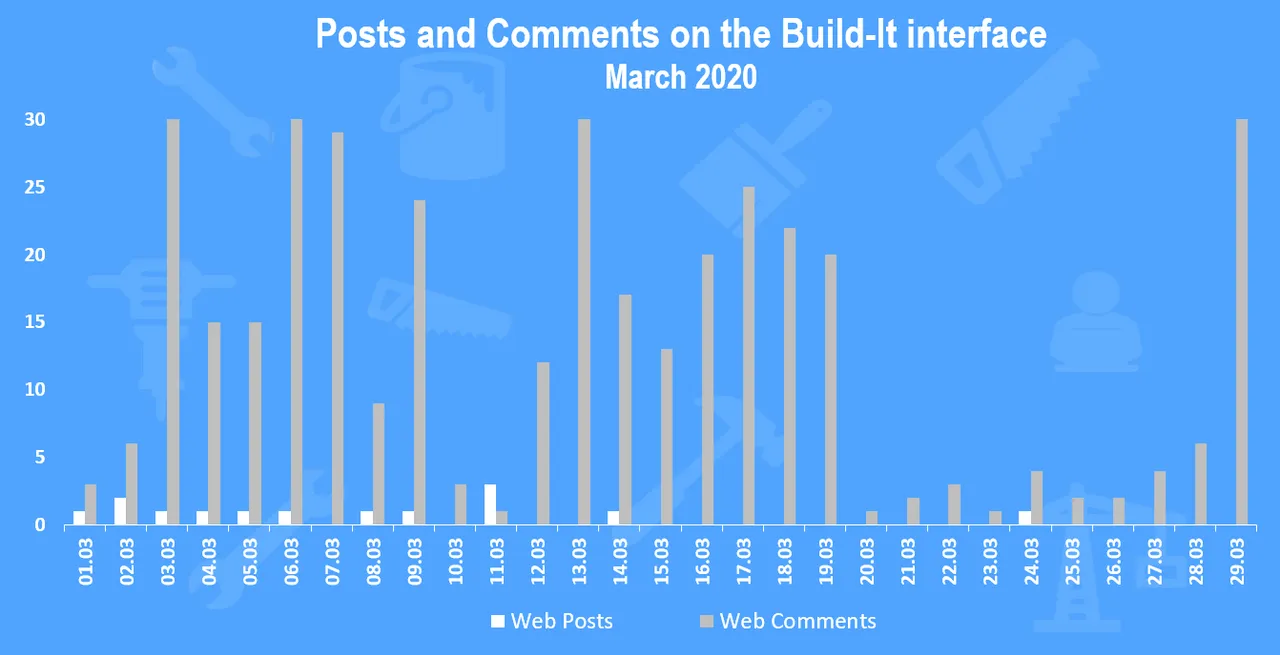
A total of 14 post in March with 396 comments on the frontend.
Price
Here is the price chart for the BUILD token with daily candles.
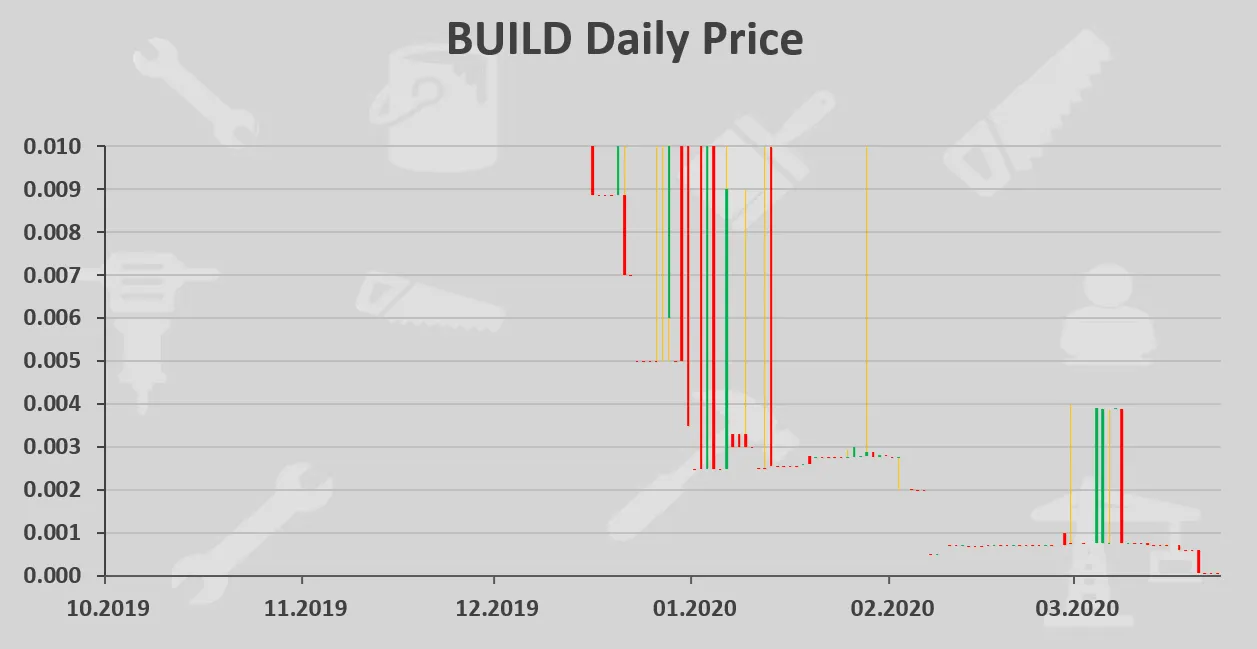
The chart is no very readable due to the large volatility and in the previous month the BUILD token dropped in price following the HF.

Build-it a community for DIY (do it yourself) projects, How-to tutorials and life hacks.
tags
build-it build-stats diy november-2019 palnet steemleo neoxian
Beneficiarie